S7 POE HPTM enrichment-POE transcription dynamics
7.1 Block 1
H3K27me3
Gene body
WL
Gene:Peak (categories of allelic bias)
##
## Lineage A:Lineage A        Lineage A:NA       Lineage A:pat Lineage B:Lineage A
##                   1                   4                   1                  11
## Lineage B:Lineage B       Lineage B:mat        Lineage B:NA       Lineage B:pat
##                   2                   7                  40                   5
##       mat:Lineage A       mat:Lineage B             mat:mat              mat:NA
##                   7                   1                   9                  20
##             mat:pat        NA:Lineage A        NA:Lineage B              NA:mat
##                  11                1215                 322                1541
##               NA:NA              NA:pat       pat:Lineage A       pat:Lineage B
##                6981                2639                  36                   5
##             pat:mat              pat:NA             pat:pat
##                  59                 229                 105
Summary of POE overlaps (00 = neither peak nor gene biased, 01 = gene unbiased, peak biased, 10 = gene biased, peak unbiased, 11 = both gene and peak show allelic bias)
##
##    00    01    10    11
## 12234    25   259   184
Fishers exact test of enrichment (do genes showing allelic bias overlap with peaks showing allelic bias)?
##
## Fisher's Exact Test for Count Data
##
## data: data.frame(x = c(tab[4], tab[3]), y = c(tab[2], tab[1]))
## p-value < 2.2e-16
## alternative hypothesis: true odds ratio is greater than 1
## 95 percent confidence interval:
## 236.9345 Inf
## sample estimates:
## odds ratio
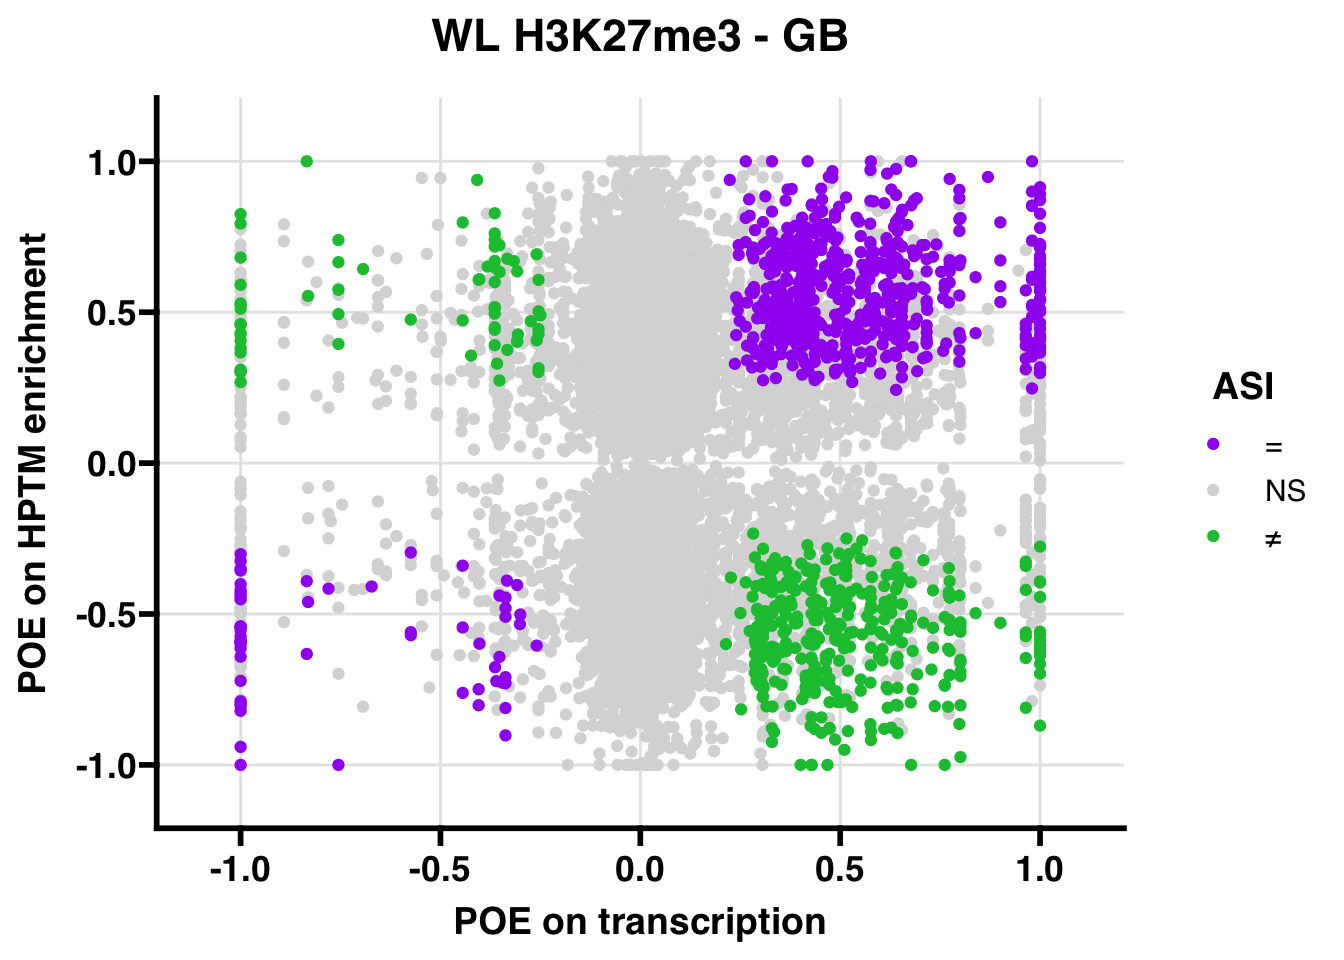
## 347.5206ASI: “allelic similarlty index”. Here, the axis values represent allelic transcription (x) and HPTM enrichment (y), with positive values being biased toward the paternal allele, and negative values being biased toward the maternal allele. ASI values are “=” for transcript and peak being baised toward the same allele, “NS” for either transcript or peak not showing allelic bias, and “≠” for biased toward opposite alleles.
QL
Gene:Peak (categories of allelic bias)
##
## Lineage A:Lineage A        Lineage A:NA       Lineage A:pat Lineage B:Lineage A
##                   2                   2                   2                   1
##       Lineage B:mat        Lineage B:NA       Lineage B:pat       mat:Lineage A
##                   1                  12                  17                   3
##       mat:Lineage B             mat:mat              mat:NA             mat:pat
##                   1                   2                  50                  31
##        NA:Lineage A        NA:Lineage B              NA:mat               NA:NA
##                 759                 338                1534                9161
##              NA:pat       pat:Lineage A       pat:Lineage B             pat:mat
##                5776                  33                  16                  49
##              pat:NA             pat:pat
##                 324                 231
Summary of overlaps (00 = neither peak nor gene biased, 01 = gene unbiased, peak biased, 10 = gene biased, peak unbiased, 11 = both gene and peak show allelic bias)
##
##    00    01    10    11
## 16843    55   366   313
Fishers exact test of enrichment (do genes showing allelic bias overlap with peaks showing allelic bias)?
##
##  Fisher's Exact Test for Count Data
##
## data:  data.frame(x = c(tab[4], tab[3]), y = c(tab[2], tab[1]))
## p-value < 2.2e-16
## alternative hypothesis: true odds ratio is greater than 1
## 95 percent confidence interval:
##  199.8675      Inf
## sample estimates:
## odds ratio
##   260.0518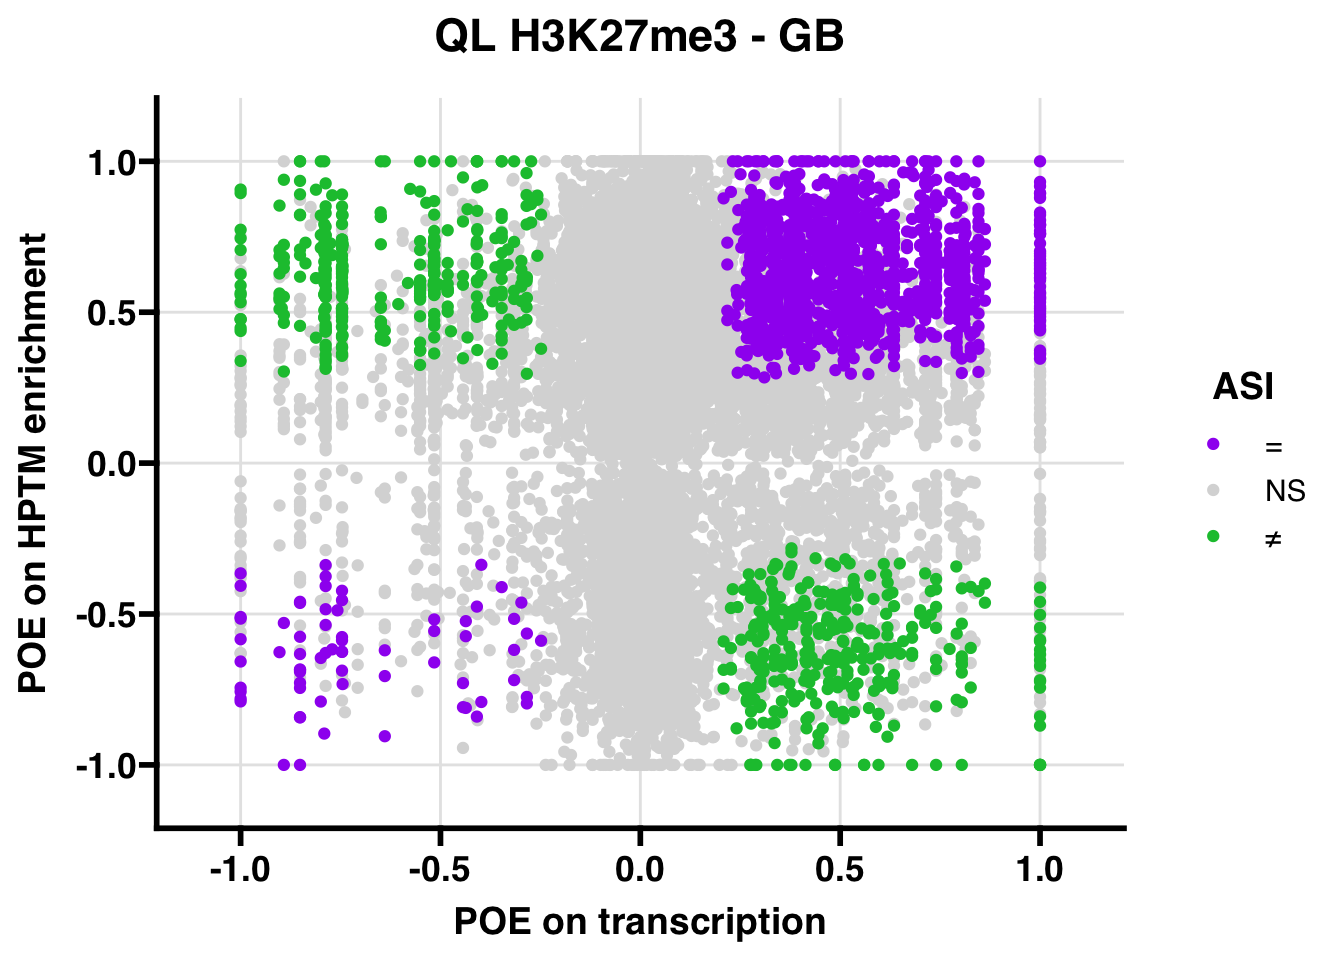
Promoter
WL
Gene:Peak (categories of allelic bias)
##
## Lineage A:Lineage A        Lineage A:NA        Lineage B:NA             mat:mat
##                   1                   1                   3                   2
##              mat:NA             mat:pat        NA:Lineage A        NA:Lineage B
##                   3                   2                 178                  39
##              NA:mat               NA:NA              NA:pat       pat:Lineage A
##                 217                1008                 371                   5
##             pat:mat              pat:NA             pat:pat
##                   8                  31                  18
Summary of overlaps (00 = neither peak nor gene biased, 01 = gene unbiased, peak biased, 10 = gene biased, peak unbiased, 11 = both gene and peak show allelic bias)
##
##   00   01   10   11
## 1775    3    5   30
Fishers exact test of enrichment (do genes showing allelic bias overlap with peaks showing allelic bias)?
##
##  Fisher's Exact Test for Count Data
##
## data:  data.frame(x = c(tab[4], tab[3]), y = c(tab[2], tab[1]))
## p-value < 2.2e-16
## alternative hypothesis: true odds ratio is greater than 1
## 95 percent confidence interval:
##  837.0586      Inf
## sample estimates:
## odds ratio
##   3190.375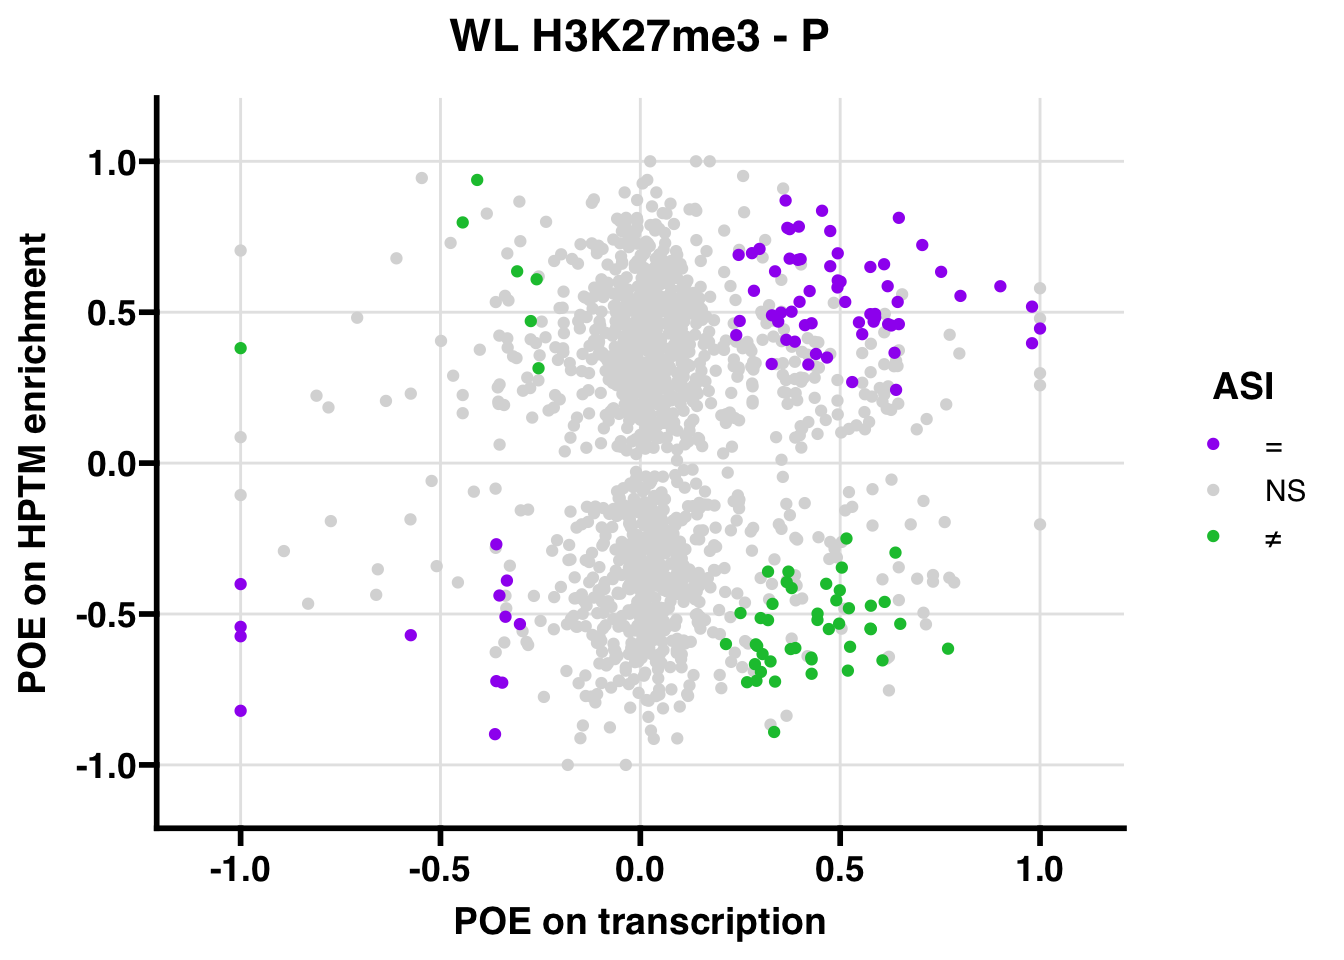
QL
Gene:Peak (categories of allelic bias)
##
##  Lineage A:NA Lineage A:pat  Lineage B:NA mat:Lineage B        mat:NA
##             2             2             2             1             2
##       mat:pat  NA:Lineage A  NA:Lineage B        NA:mat         NA:NA
##             2           118            37           187          1164
##        NA:pat pat:Lineage A       pat:mat        pat:NA       pat:pat
##           899             8            10            38            34
Summary of overlaps (00 = neither peak nor gene biased, 01 = gene unbiased, peak biased, 10 = gene biased, peak unbiased, 11 = both gene and peak show allelic bias)
##
##   00   01   10   11
## 2341   11   12   46
Fishers exact test of enrichment (do genes showing allelic bias overlap with peaks showing allelic bias)?
##
##  Fisher's Exact Test for Count Data
##
## data:  data.frame(x = c(tab[4], tab[3]), y = c(tab[2], tab[1]))
## p-value < 2.2e-16
## alternative hypothesis: true odds ratio is greater than 1
## 95 percent confidence interval:
##  358.0999      Inf
## sample estimates:
## odds ratio
##   798.7605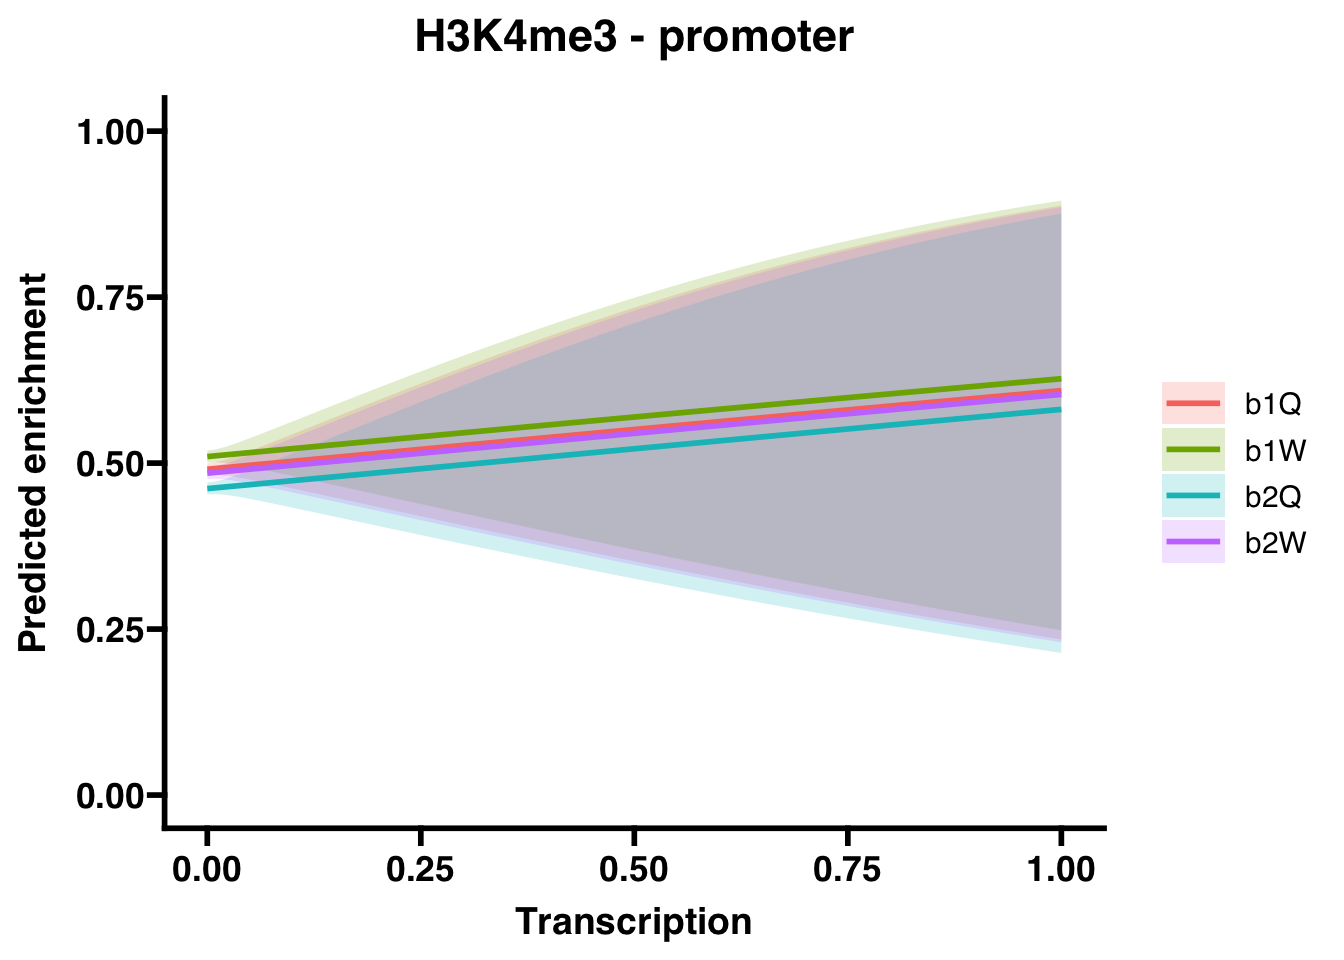
H3K27ac
Gene body
WL
Gene:Peak (categories of allelic bias)
##
## Lineage A:Lineage A        Lineage A:NA       Lineage A:pat Lineage B:Lineage A
##                   2                   7                   1                   7
## Lineage B:Lineage B       Lineage B:mat        Lineage B:NA       Lineage B:pat
##                   1                  16                  41                  11
##       mat:Lineage A       mat:Lineage B             mat:mat              mat:NA
##                   3                   1                   2                  27
##             mat:pat        NA:Lineage A        NA:Lineage B              NA:mat
##                  16                1086                 247                1864
##               NA:NA              NA:pat       pat:Lineage A       pat:Lineage B
##                7627                2986                  32                  10
##             pat:mat              pat:NA             pat:pat
##                  63                 233                 120
Summary of overlaps (00 = neither peak nor gene biased, 01 = gene unbiased, peak biased, 10 = gene biased, peak unbiased, 11 = both gene and peak show allelic bias)
##
##    00    01    10    11
## 13326    32   253   201
Fishers exact test of enrichment (do genes showing allelic bias overlap with peaks showing allelic bias)?
##
##  Fisher's Exact Test for Count Data
##
## data:  data.frame(x = c(tab[4], tab[3]), y = c(tab[2], tab[1]))
## p-value < 2.2e-16
## alternative hypothesis: true odds ratio is greater than 1
## 95 percent confidence interval:
##  233.7337      Inf
## sample estimates:
## odds ratio
##   332.4454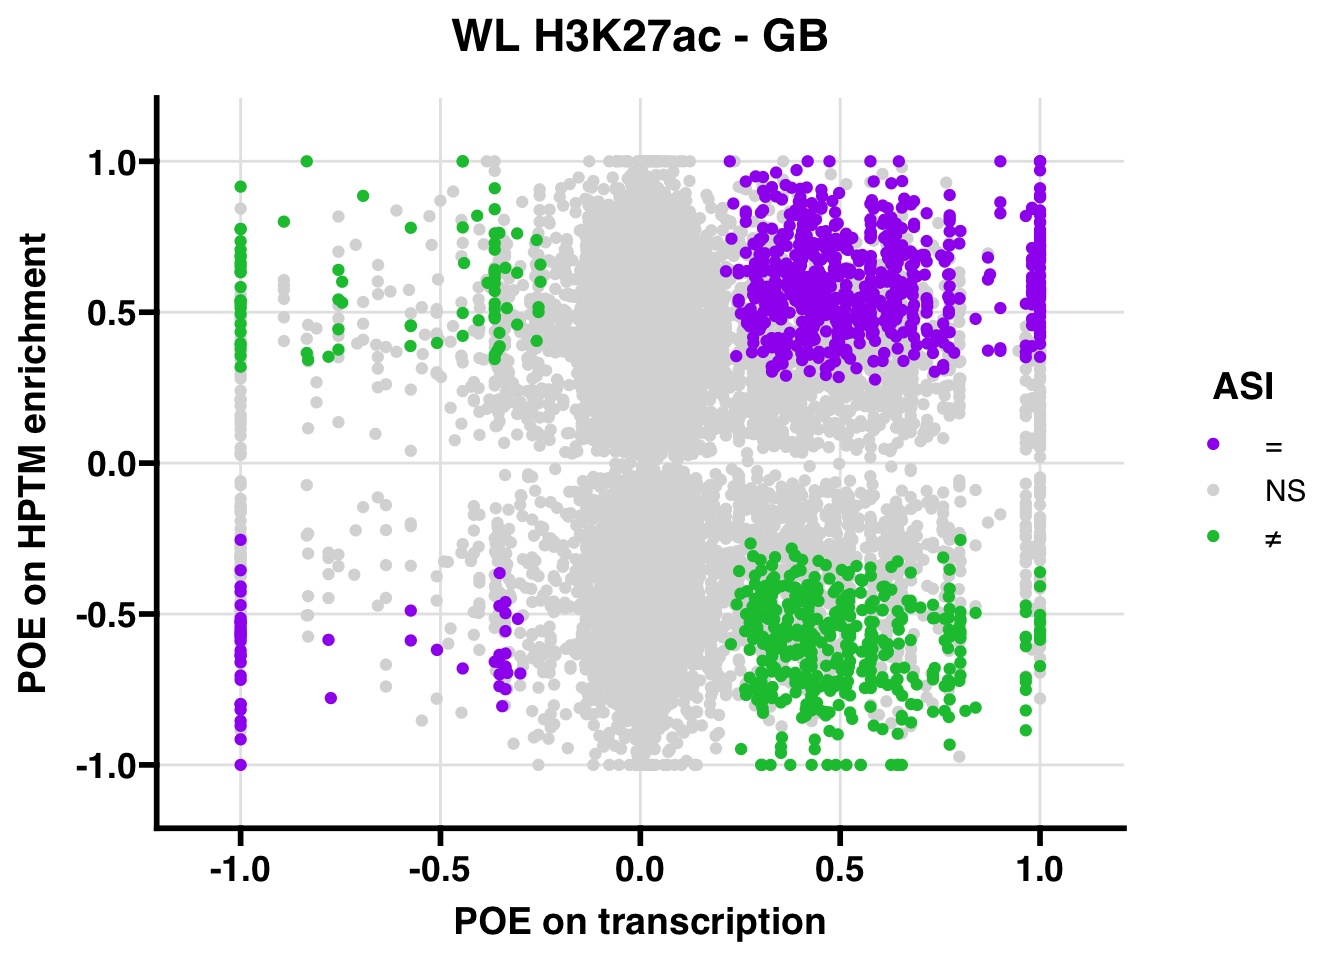
QL
Gene:Peak (categories of allelic bias)
##
##        Lineage A:NA       Lineage A:pat Lineage B:Lineage A Lineage B:Lineage B
##                   2                   5                   1                   1
##       Lineage B:mat        Lineage B:NA       Lineage B:pat       mat:Lineage A
##                   1                  18                  16                   5
##       mat:Lineage B             mat:mat              mat:NA             mat:pat
##                   1                   1                  39                  19
##        NA:Lineage A        NA:Lineage B              NA:mat               NA:NA
##                 919                 430                1333                8827
##              NA:pat       pat:Lineage A       pat:Lineage B             pat:mat
##                5847                  31                  24                  48
##              pat:NA             pat:pat
##                 320                 250
Summary of overlaps (00 = neither peak nor gene biased, 01 = gene unbiased, peak biased, 10 = gene biased, peak unbiased, 11 = both gene and peak show allelic bias)
##
##    00    01    10    11
## 16609    69   366   318
Fishers exact test of enrichment (do genes showing allelic bias overlap with peaks showing allelic bias)?
##
##  Fisher's Exact Test for Count Data
##
## data:  data.frame(x = c(tab[4], tab[3]), y = c(tab[2], tab[1]))
## p-value < 2.2e-16
## alternative hypothesis: true odds ratio is greater than 1
## 95 percent confidence interval:
##  164.6826      Inf
## sample estimates:
## odds ratio
##   208.1453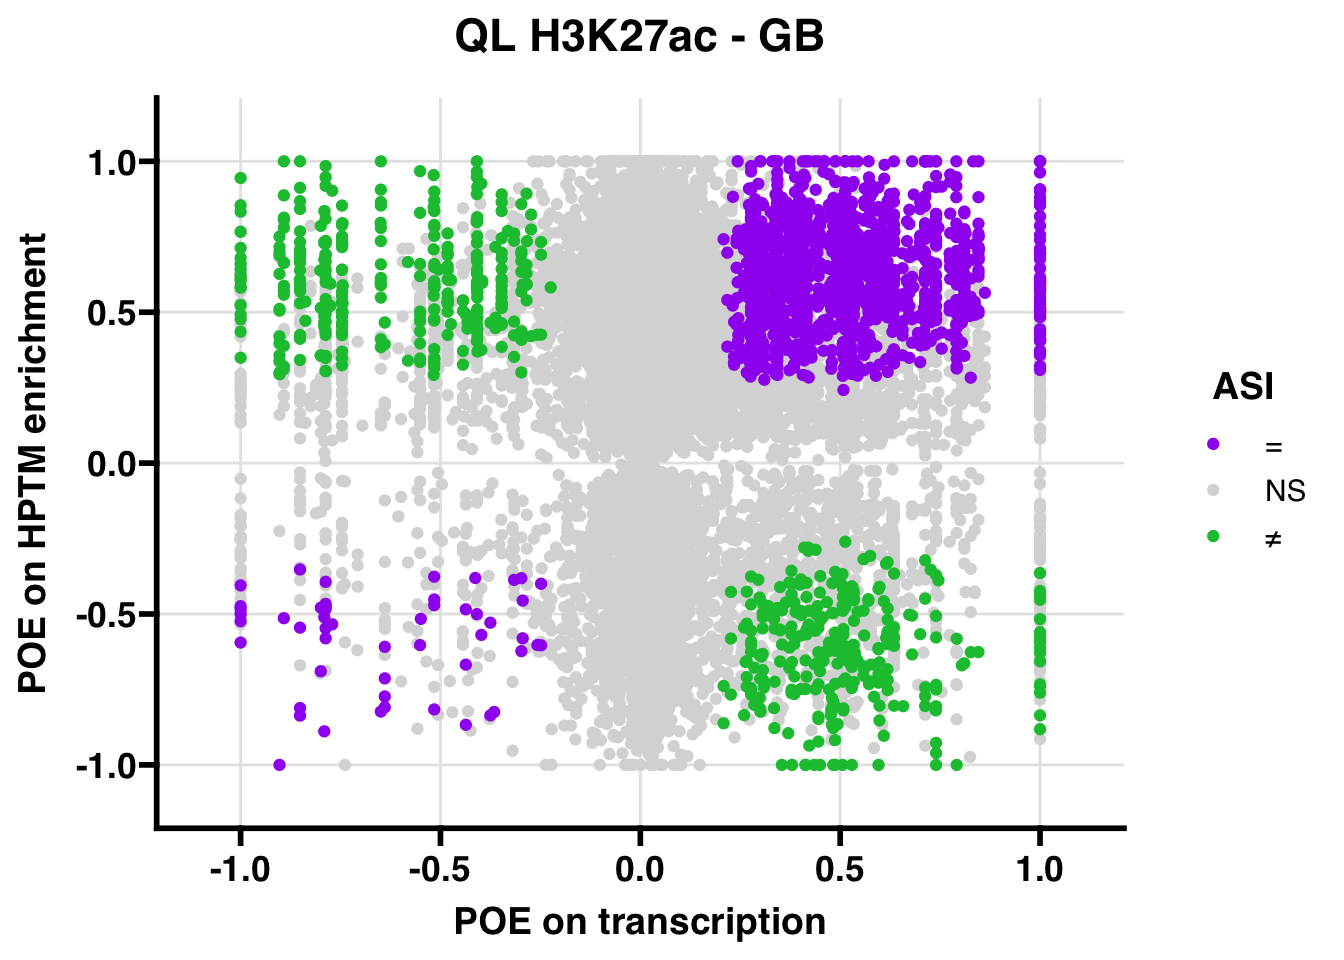
Promoter
WL
Gene:Peak (categories of allelic bias)
##
## Lineage A:Lineage A        Lineage A:NA        Lineage B:NA       Lineage B:pat
##                   1                   1                   3                   2
##             mat:mat              mat:NA             mat:pat        NA:Lineage A
##                   2                   3                   1                 180
##        NA:Lineage B              NA:mat               NA:NA              NA:pat
##                  38                 265                1256                 482
##       pat:Lineage A       pat:Lineage B             pat:mat              pat:NA
##                   3                   3                   9                  40
##             pat:pat
##                  20
Summary of overlaps (00 = neither peak nor gene biased, 01 = gene unbiased, peak biased, 10 = gene biased, peak unbiased, 11 = both gene and peak show allelic bias)
##
##   00   01   10   11
## 2176    7    7   32
Fishers exact test of enrichment (do genes showing allelic bias overlap with peaks showing allelic bias)?
##
##  Fisher's Exact Test for Count Data
##
## data:  data.frame(x = c(tab[4], tab[3]), y = c(tab[2], tab[1]))
## p-value < 2.2e-16
## alternative hypothesis: true odds ratio is greater than 1
## 95 percent confidence interval:
##  488.4372      Inf
## sample estimates:
## odds ratio
##   1342.753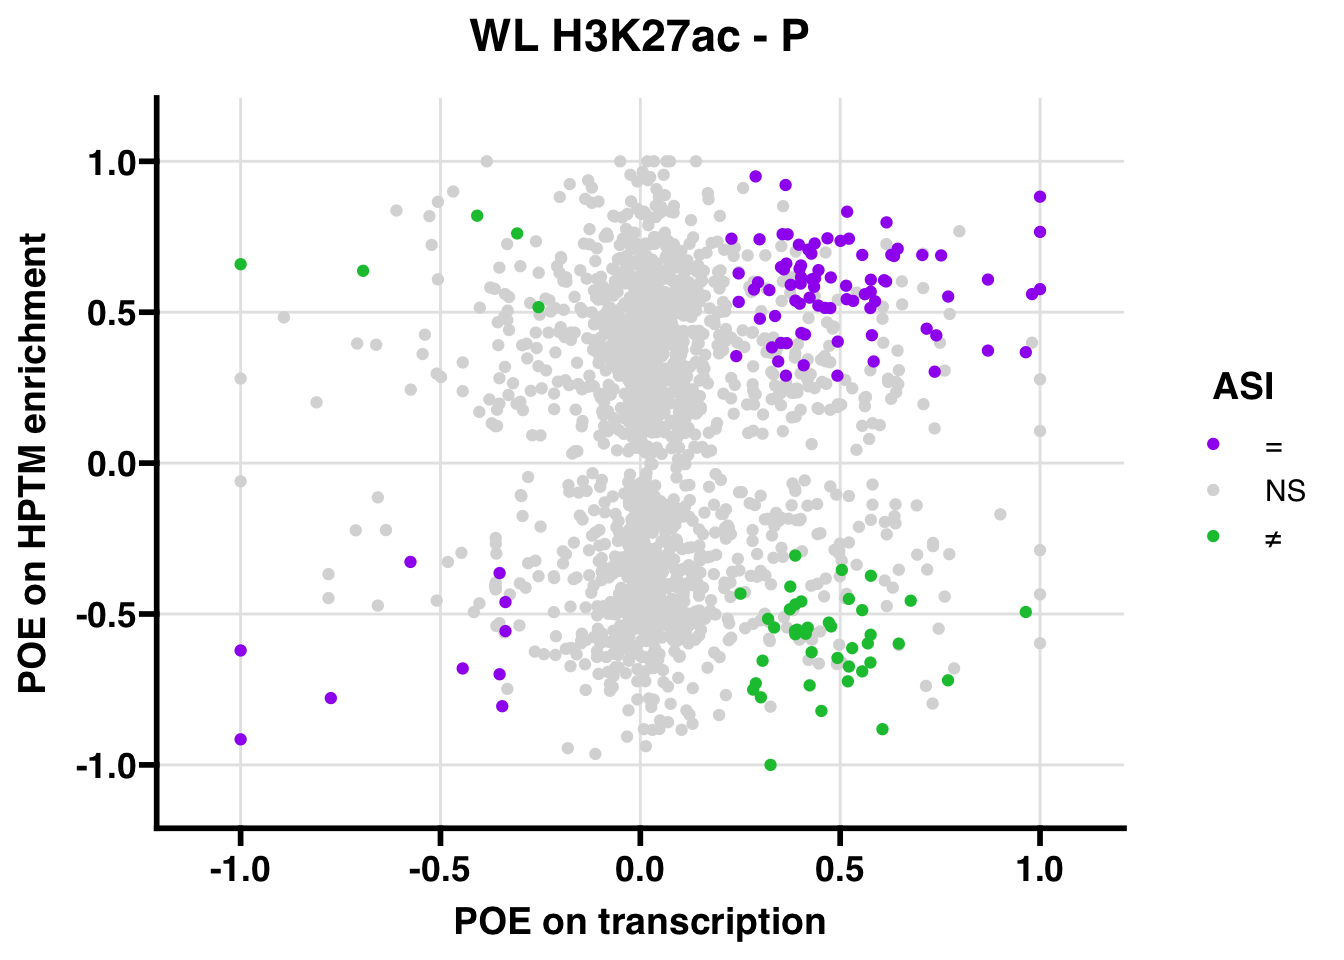
QL
Gene:Peak (categories of allelic bias)
##
##  Lineage A:NA Lineage A:pat  Lineage B:NA Lineage B:pat mat:Lineage B
##             1             3             1             1             1
##        mat:NA       mat:pat  NA:Lineage A  NA:Lineage B        NA:mat
##             2             1           113            56           192
##         NA:NA        NA:pat pat:Lineage A pat:Lineage B       pat:mat
##          1219           859             2             2             6
##        pat:NA       pat:pat
##            42            33
Summary of overlaps (00 = neither peak nor gene biased, 01 = gene unbiased, peak biased, 10 = gene biased, peak unbiased, 11 = both gene and peak show allelic bias)
##
##   00   01   10   11
## 2380   11   12   40
Fishers exact test of enrichment (do genes showing allelic bias overlap with peaks showing allelic bias)?
##
##  Fisher's Exact Test for Count Data
##
## data:  data.frame(x = c(tab[4], tab[3]), y = c(tab[2], tab[1]))
## p-value < 2.2e-16
## alternative hypothesis: true odds ratio is greater than 1
## 95 percent confidence interval:
##  313.8559      Inf
## sample estimates:
## odds ratio
##   700.1813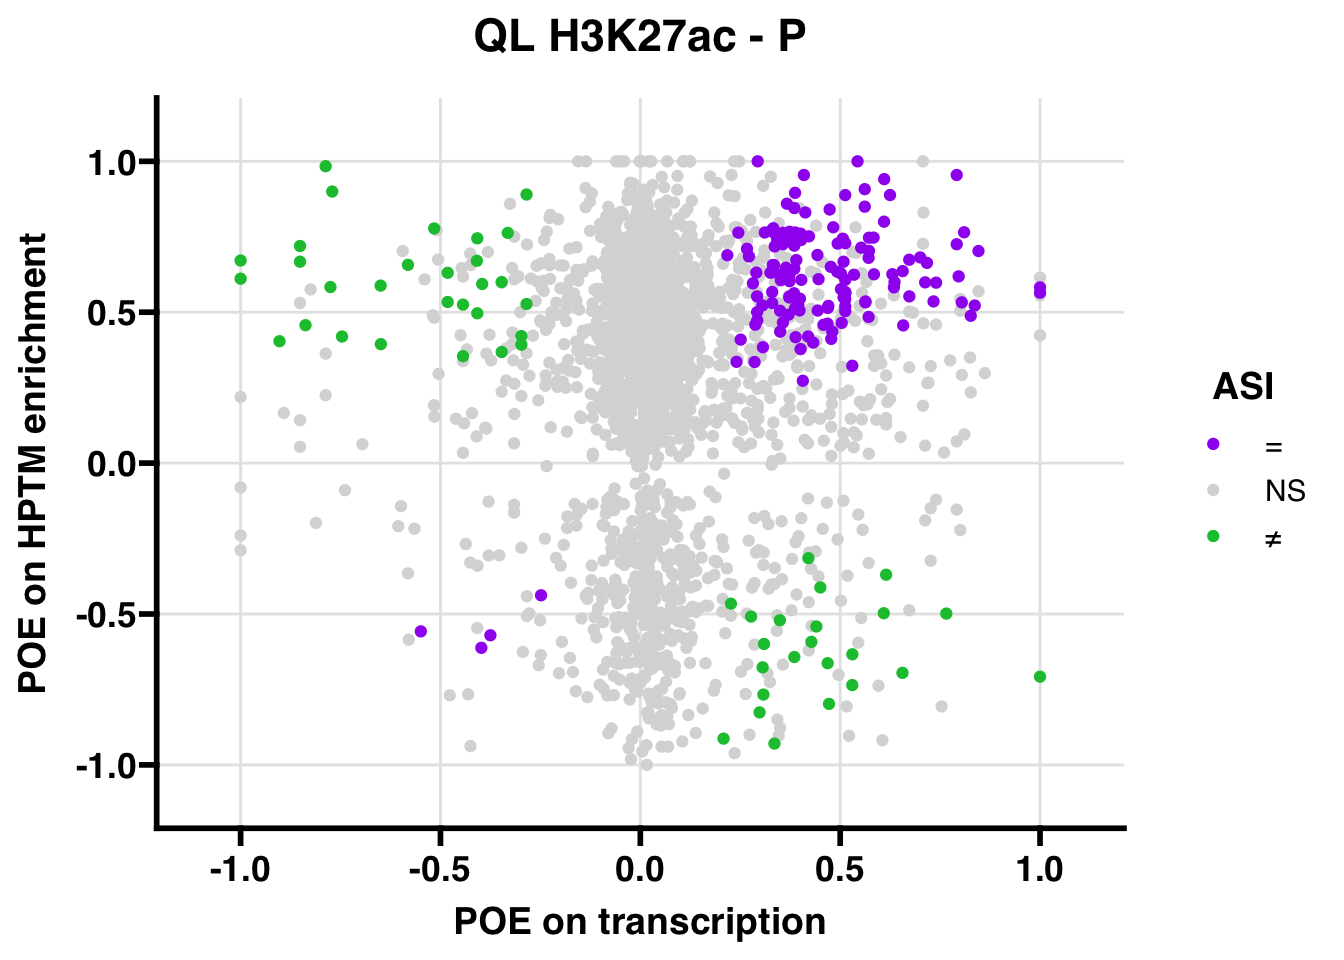
H3K4me3
Gene body
WL
Gene:Peak (categories of allelic bias)
##
## Lineage A:Lineage A        Lineage A:NA       Lineage A:pat Lineage B:Lineage A
##                   2                   5                   4                   3
## Lineage B:Lineage B       Lineage B:mat        Lineage B:NA       Lineage B:pat
##                   1                  13                  32                   9
##       mat:Lineage A             mat:mat              mat:NA             mat:pat
##                   2                   6                  21                  12
##        NA:Lineage A        NA:Lineage B              NA:mat               NA:NA
##                 539                 128                1786                7420
##              NA:pat       pat:Lineage A       pat:Lineage B             pat:mat
##                2843                  14                   6                  48
##              pat:NA             pat:pat
##                 213                 110
Summary of overlaps (00 = neither peak nor gene biased, 01 = gene unbiased, peak biased, 10 = gene biased, peak unbiased, 11 = both gene and peak show allelic bias)
##
##    00    01    10    11
## 12322    14   208   176
Fishers exact test of enrichment (do genes showing allelic bias overlap with peaks showing allelic bias)?
##
##  Fisher's Exact Test for Count Data
##
## data:  data.frame(x = c(tab[4], tab[3]), y = c(tab[2], tab[1]))
## p-value < 2.2e-16
## alternative hypothesis: true odds ratio is greater than 1
## 95 percent confidence interval:
##  459.8188      Inf
## sample estimates:
## odds ratio
##   741.8472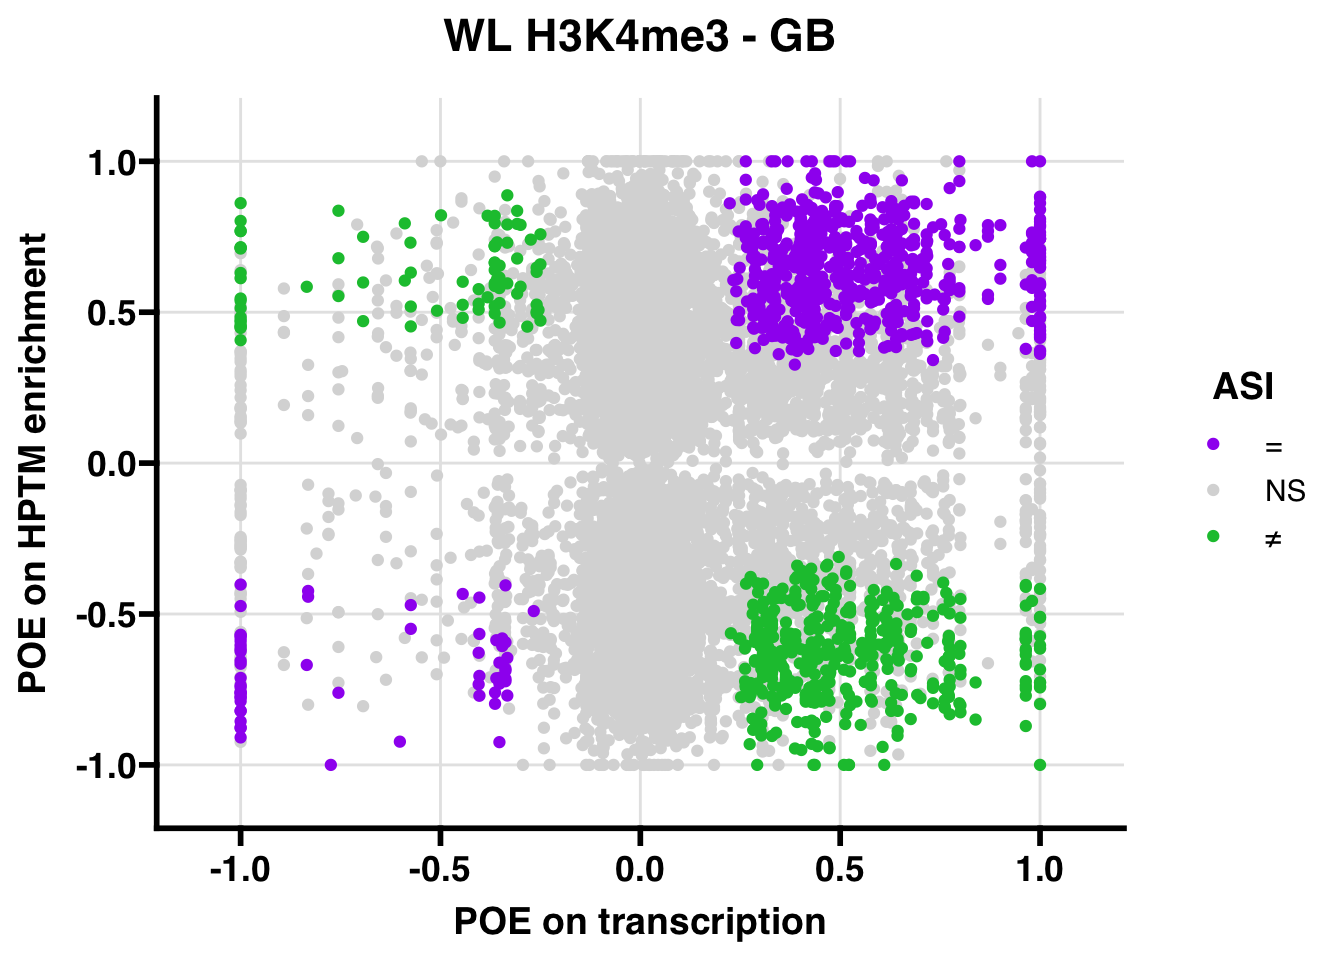
QL
Gene:Peak (categories of allelic bias)
##
## Lineage A:Lineage A        Lineage A:NA       Lineage A:pat Lineage B:Lineage B
##                   1                   3                   4                   1
##       Lineage B:mat        Lineage B:NA       Lineage B:pat       mat:Lineage A
##                   2                  15                   9                   5
##       mat:Lineage B             mat:mat              mat:NA             mat:pat
##                   1                   4                  28                  26
##        NA:Lineage A        NA:Lineage B              NA:mat               NA:NA
##                 609                 272                1237                8025
##              NA:pat       pat:Lineage A       pat:Lineage B             pat:mat
##                4844                  25                  22                  43
##              pat:NA             pat:pat
##                 297                 224
Summary of overlaps (00 = neither peak nor gene biased, 01 = gene unbiased, peak biased, 10 = gene biased, peak unbiased, 11 = both gene and peak show allelic bias)
##
##    00    01    10    11
## 14332    41   329   297
Fishers exact test of enrichment (do genes showing allelic bias overlap with peaks showing allelic bias)?
##
##  Fisher's Exact Test for Count Data
##
## data:  data.frame(x = c(tab[4], tab[3]), y = c(tab[2], tab[1]))
## p-value < 2.2e-16
## alternative hypothesis: true odds ratio is greater than 1
## 95 percent confidence interval:
##  235.3106      Inf
## sample estimates:
## odds ratio
##   315.9013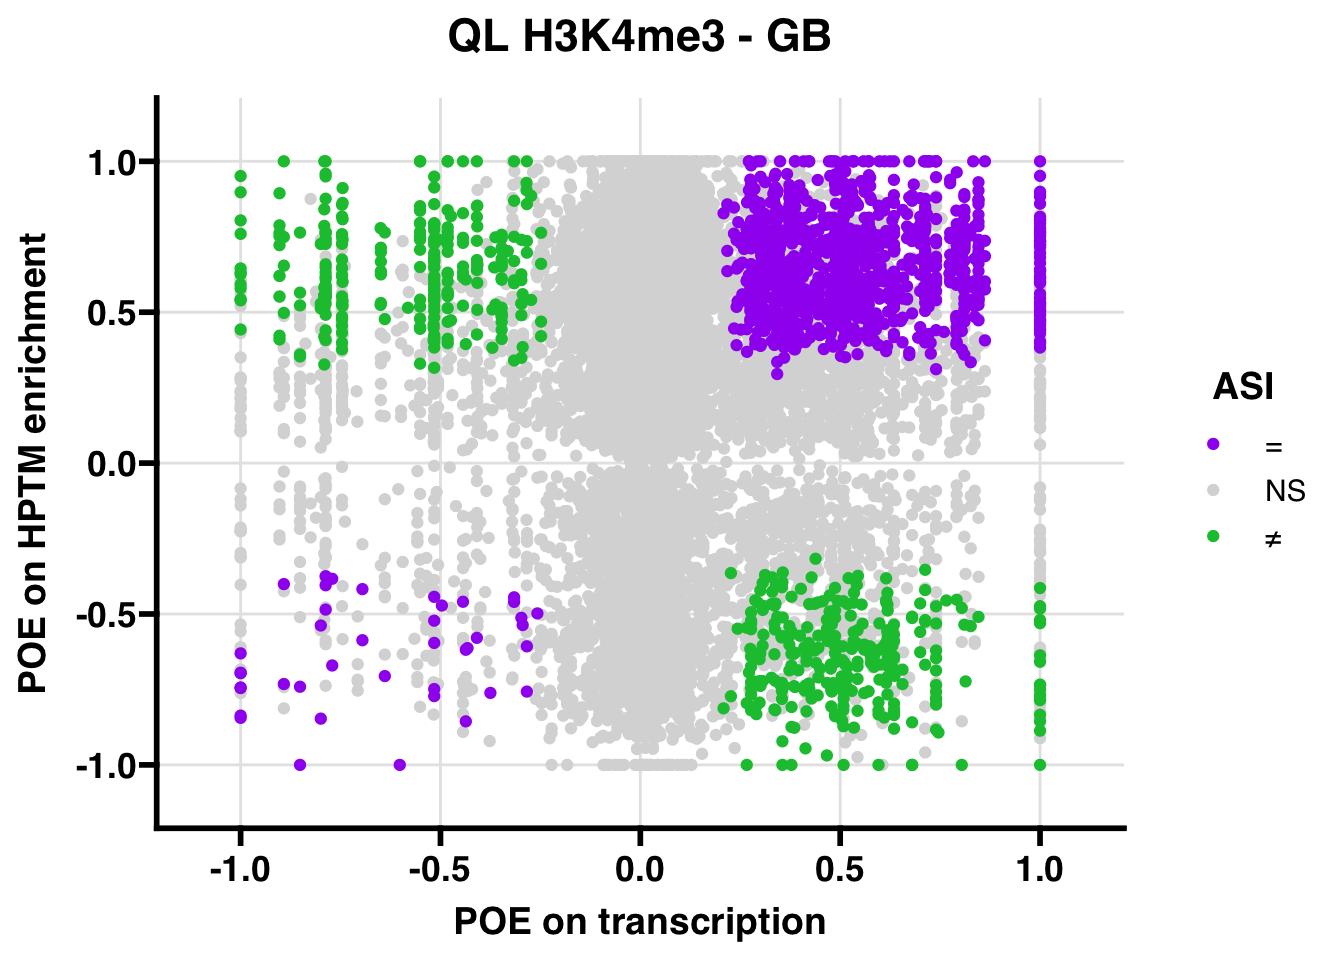
Promoter
WL
Gene:Peak (categories of allelic bias)
##
## Lineage A:Lineage A        Lineage A:NA       Lineage A:pat        Lineage B:NA
##                   1                   1                   1                   1
##       Lineage B:pat             mat:mat              mat:NA             mat:pat
##                   3                   1                   2                   1
##        NA:Lineage A        NA:Lineage B              NA:mat               NA:NA
##                  94                  17                 267                1104
##              NA:pat       pat:Lineage A       pat:Lineage B             pat:mat
##                 465                   3                   1                   8
##              pat:NA             pat:pat
##                  33                  26
Summary of overlaps (00 = neither peak nor gene biased, 01 = gene unbiased, peak biased, 10 = gene biased, peak unbiased, 11 = both gene and peak show allelic bias)
##
##   00   01   10   11
## 1907    3    3   36
Fishers exact test of enrichment (do genes showing allelic bias overlap with peaks showing allelic bias)?
##
##  Fisher's Exact Test for Count Data
##
## data:  data.frame(x = c(tab[4], tab[3]), y = c(tab[2], tab[1]))
## p-value < 2.2e-16
## alternative hypothesis: true odds ratio is greater than 1
## 95 percent confidence interval:
##  1602.424      Inf
## sample estimates:
## odds ratio
##   7569.223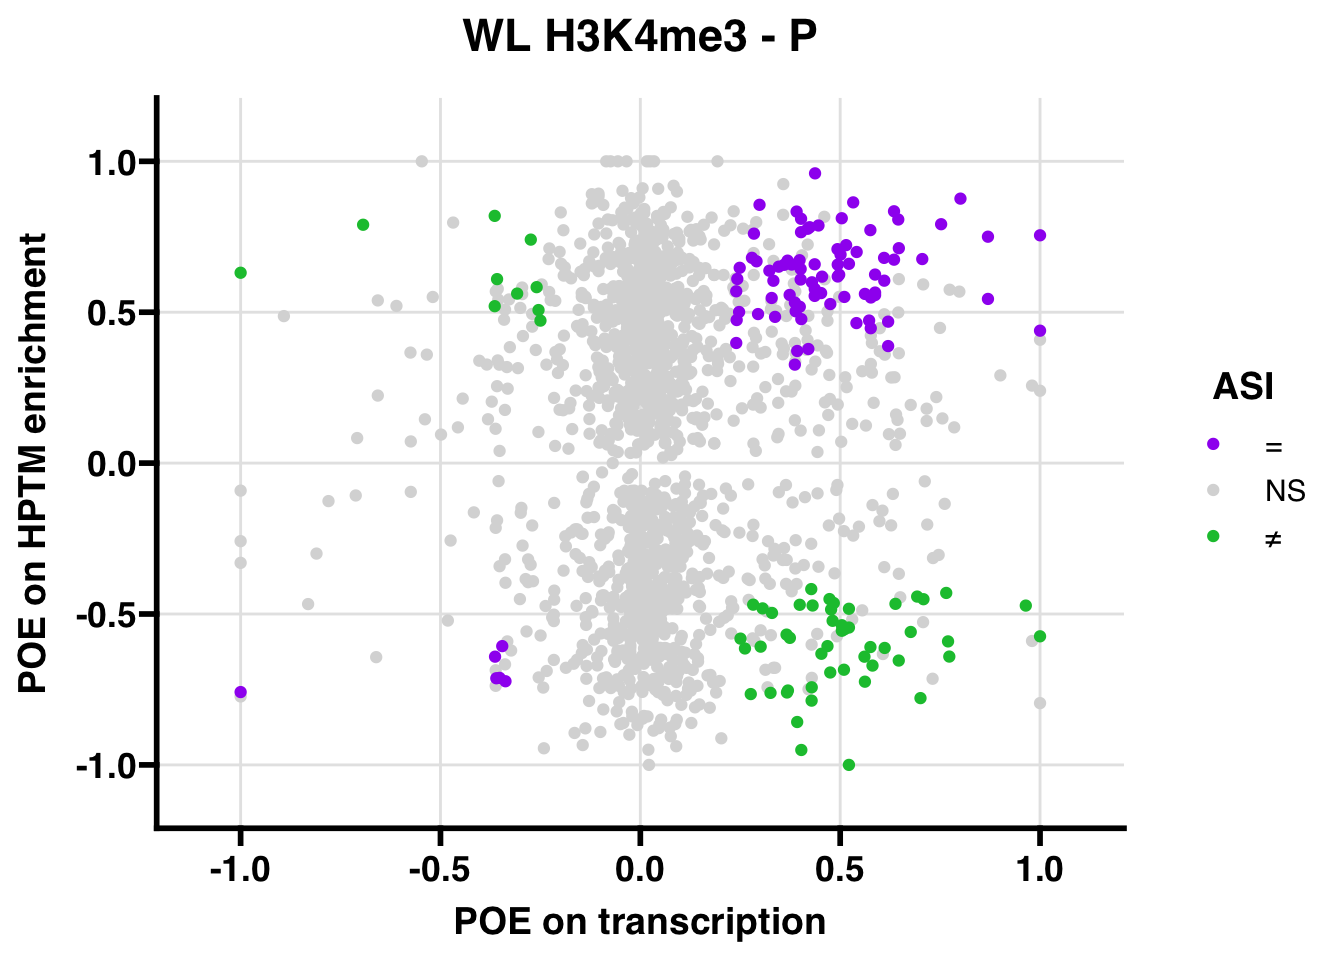
QL
Gene:Peak (categories of allelic bias)
##
##  Lineage A:NA Lineage A:pat Lineage B:pat mat:Lineage B       mat:mat
##             3             3             2             1             2
##        mat:NA  NA:Lineage A  NA:Lineage B        NA:mat         NA:NA
##             2            74            36           167          1075
##        NA:pat pat:Lineage A pat:Lineage B       pat:mat        pat:NA
##           697             1             3             3            44
##       pat:pat
##            35
Summary of overlaps (00 = neither peak nor gene biased, 01 = gene unbiased, peak biased, 10 = gene biased, peak unbiased, 11 = both gene and peak show allelic bias)
##
##   00   01   10   11
## 1998    6    9   40
Fishers exact test of enrichment (do genes showing allelic bias overlap with peaks showing allelic bias)?
##
##  Fisher's Exact Test for Count Data
##
## data:  data.frame(x = c(tab[4], tab[3]), y = c(tab[2], tab[1]))
## p-value < 2.2e-16
## alternative hypothesis: true odds ratio is greater than 1
## 95 percent confidence interval:
##  521.7834      Inf
## sample estimates:
## odds ratio
##   1346.678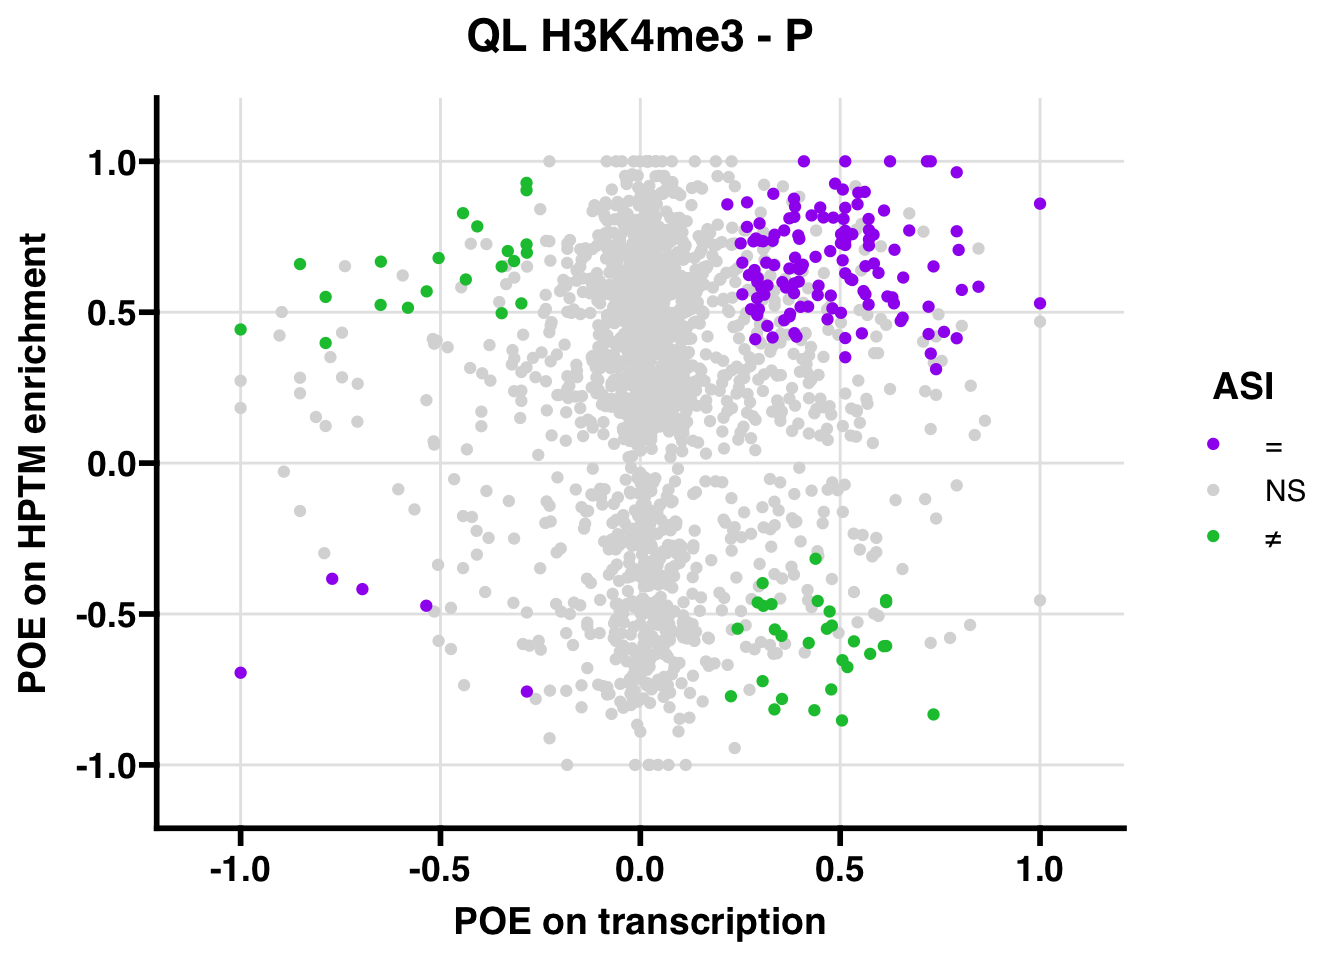
7.2 Block 2
H3K27me3
Gene body
WL
Gene:Peak (categories of allelic bias)
##
## Lineage B:Lineage A       Lineage B:mat        Lineage B:NA       Lineage B:pat
##                   1                   1                  11                   3
##       mat:Lineage A       mat:Lineage B             mat:mat              mat:NA
##                   4                   3                  19                  54
##             mat:pat        NA:Lineage A        NA:Lineage B              NA:mat
##                  10                 569                 727                1436
##               NA:NA              NA:pat       pat:Lineage A       pat:Lineage B
##                5053                1949                   6                  17
##             pat:mat              pat:NA             pat:pat
##                  37                  83                  29
Summary of overlaps (00 = neither peak nor gene biased, 01 = gene unbiased, peak biased, 10 = gene biased, peak unbiased, 11 = both gene and peak show allelic bias)
##
##   00   01   10   11
## 9474   23  145   95
Fishers exact test of enrichment (do genes showing allelic bias overlap with peaks showing allelic bias)?
##
##  Fisher's Exact Test for Count Data
##
## data:  data.frame(x = c(tab[4], tab[3]), y = c(tab[2], tab[1]))
## p-value < 2.2e-16
## alternative hypothesis: true odds ratio is greater than 1
## 95 percent confidence interval:
##  175.8221      Inf
## sample estimates:
## odds ratio
##    269.862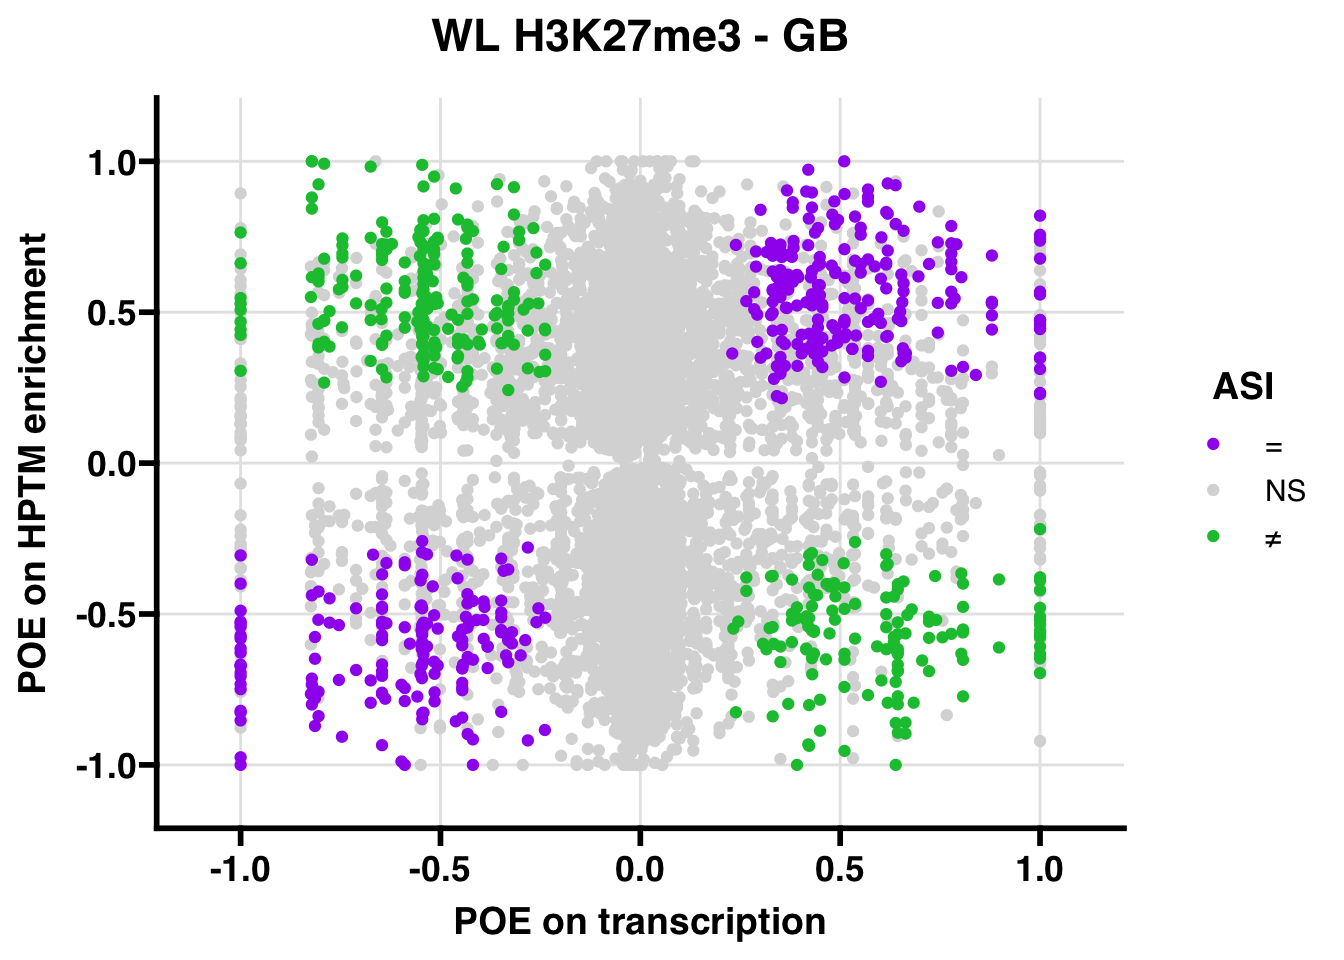
QL
Gene:Peak (categories of allelic bias)
##
## Lineage B:Lineage A Lineage B:Lineage B       Lineage B:mat        Lineage B:NA
##                   1                   2                   3                   7
##       Lineage B:pat       mat:Lineage A       mat:Lineage B             mat:mat
##                   6                   1                   1                   1
##              mat:NA             mat:pat        NA:Lineage A        NA:Lineage B
##                  15                   6                 563                 617
##              NA:mat               NA:NA              NA:pat       pat:Lineage A
##                 941                5414                3362                   3
##       pat:Lineage B             pat:mat              pat:NA             pat:pat
##                   8                  10                  84                  73
Summary of overlaps (00 = neither peak nor gene biased, 01 = gene unbiased, peak biased, 10 = gene biased, peak unbiased, 11 = both gene and peak show allelic bias)
##
##    00    01    10    11
## 10691    26    98    90
Fishers exact test of enrichment (do genes showing allelic bias overlap with peaks showing allelic bias)?
##
##  Fisher's Exact Test for Count Data
##
## data:  data.frame(x = c(tab[4], tab[3]), y = c(tab[2], tab[1]))
## p-value < 2.2e-16
## alternative hypothesis: true odds ratio is greater than 1
## 95 percent confidence interval:
##  245.3571      Inf
## sample estimates:
## odds ratio
##   374.0261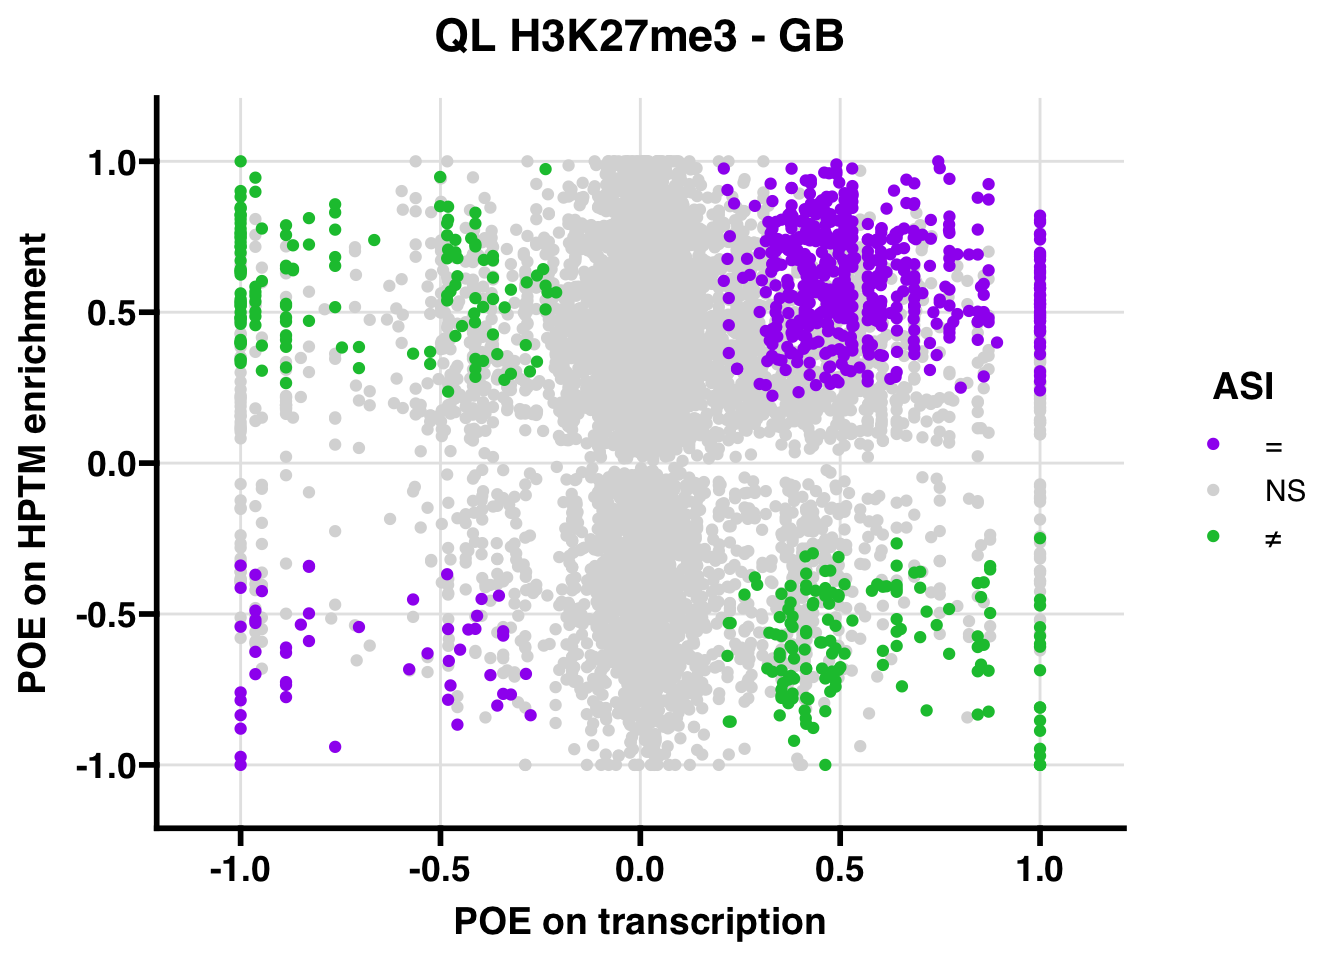
Promoter
WL
Gene:Peak (categories of allelic bias)
##
##       mat:mat        mat:NA       mat:pat  NA:Lineage A  NA:Lineage B
##             1             9             1            72            79
##        NA:mat         NA:NA        NA:pat pat:Lineage A pat:Lineage B
##           220           763           249             1             1
##       pat:mat        pat:NA       pat:pat
##             2            11             3
Summary of overlaps (00 = neither peak nor gene biased, 01 = gene unbiased, peak biased, 10 = gene biased, peak unbiased, 11 = both gene and peak show allelic bias)
##
##   00   01   11
## 1376    3    7
Fishers exact test of enrichment (do genes showing allelic bias overlap with peaks showing allelic bias)?
## [1] "NA"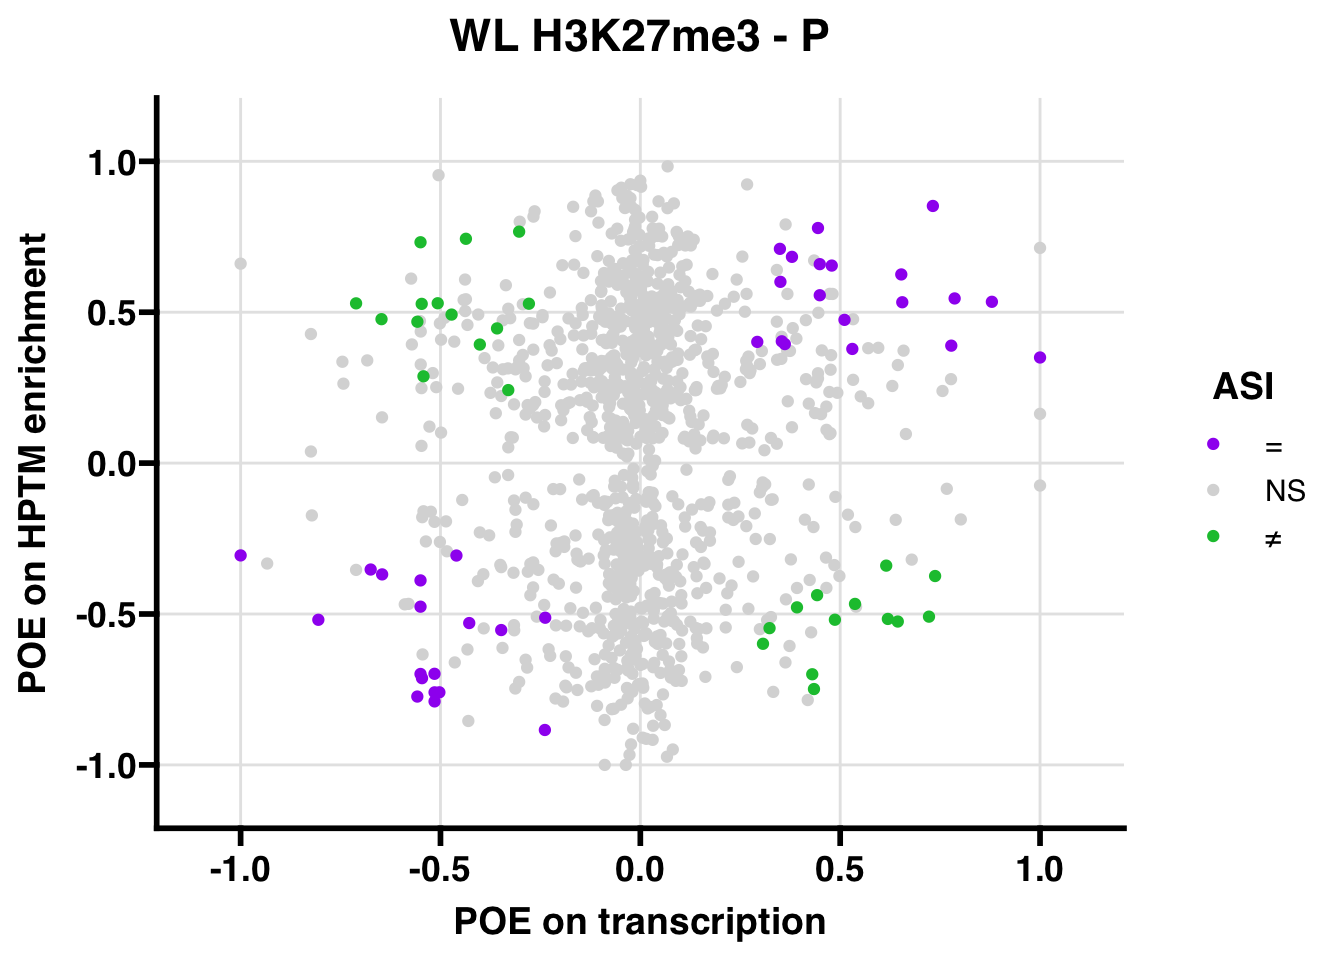
QL
Gene:Peak (categories of allelic bias)
##
##  Lineage B:NA Lineage B:pat        mat:NA       mat:pat  NA:Lineage A
##             1             1             3             3            86
##  NA:Lineage B        NA:mat         NA:NA        NA:pat pat:Lineage A
##            99           129           865           561             1
## pat:Lineage B        pat:NA       pat:pat
##             3            20            16
Summary of overlaps (00 = neither peak nor gene biased, 01 = gene unbiased, peak biased, 10 = gene biased, peak unbiased, 11 = both gene and peak show allelic bias)
##
##   00   01   10   11
## 1720    2    4   19
Fishers exact test of enrichment (do genes showing allelic bias overlap with peaks showing allelic bias)?
##
##  Fisher's Exact Test for Count Data
##
## data:  data.frame(x = c(tab[4], tab[3]), y = c(tab[2], tab[1]))
## p-value < 2.2e-16
## alternative hypothesis: true odds ratio is greater than 1
## 95 percent confidence interval:
##  721.7098      Inf
## sample estimates:
## odds ratio
##   3533.803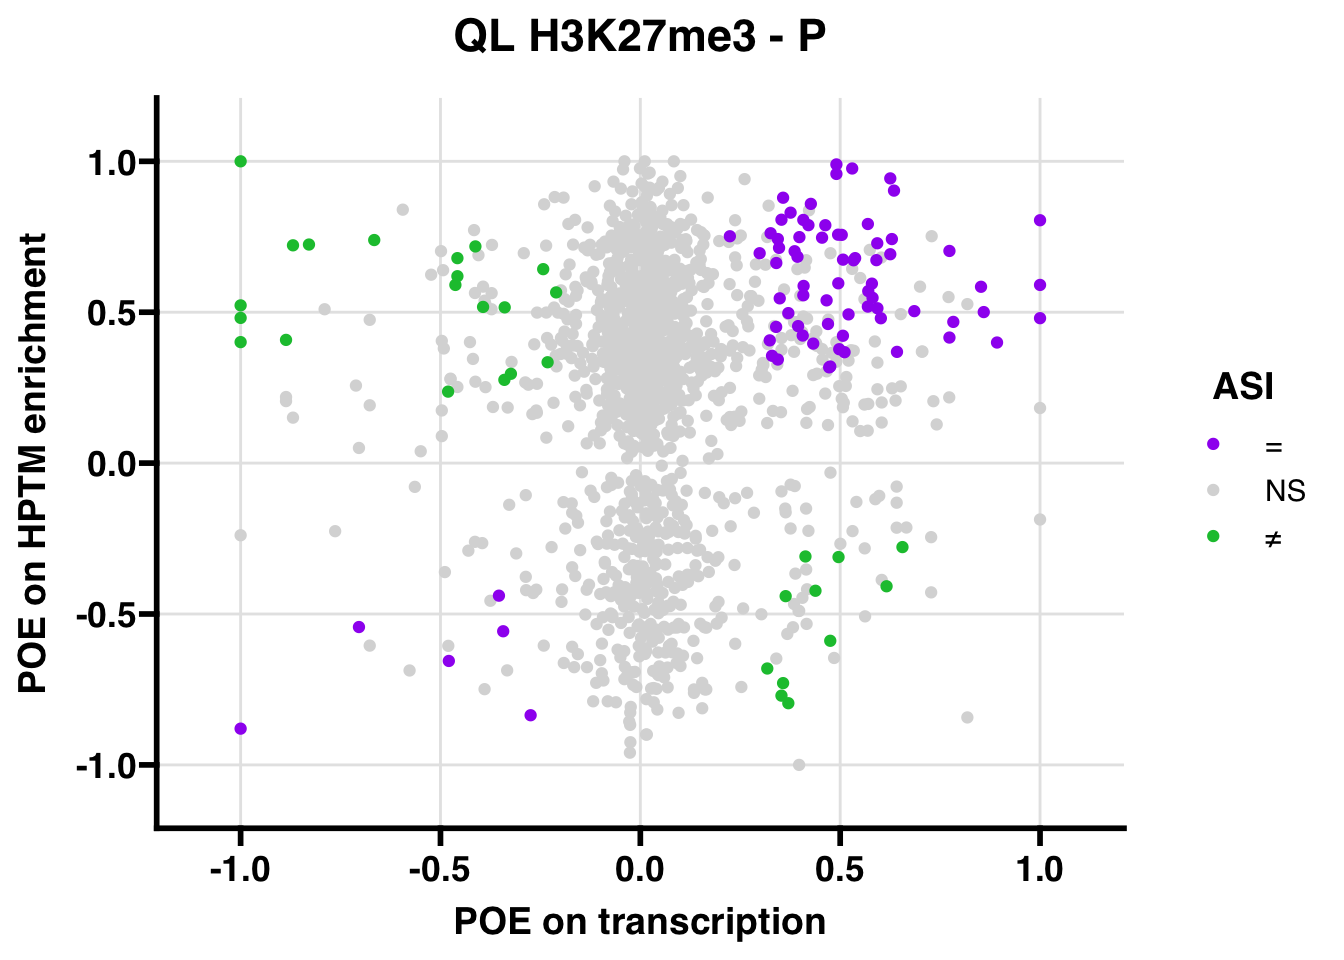
H3K27ac
Gene body
WL
Gene:Peak (categories of allelic bias)
##
## Lineage B:Lineage A       Lineage B:mat        Lineage B:NA       Lineage B:pat
##                   1                   2                   6                   3
##       mat:Lineage A       mat:Lineage B             mat:mat              mat:NA
##                   3                   6                  10                  41
##             mat:pat        NA:Lineage A        NA:Lineage B              NA:mat
##                   9                 282                 336                 843
##               NA:NA              NA:pat       pat:Lineage A       pat:Lineage B
##                2933                1191                   2                   9
##             pat:mat              pat:NA             pat:pat
##                  24                  40                  28
Summary of overlaps (00 = neither peak nor gene biased, 01 = gene unbiased, peak biased, 10 = gene biased, peak unbiased, 11 = both gene and peak show allelic bias)
##
##   00   01   10   11
## 5415   16   85   71
Fishers exact test of enrichment (do genes showing allelic bias overlap with peaks showing allelic bias)?
##
##  Fisher's Exact Test for Count Data
##
## data:  data.frame(x = c(tab[4], tab[3]), y = c(tab[2], tab[1]))
## p-value < 2.2e-16
## alternative hypothesis: true odds ratio is greater than 1
## 95 percent confidence interval:
##  167.0016      Inf
## sample estimates:
## odds ratio
##   281.5192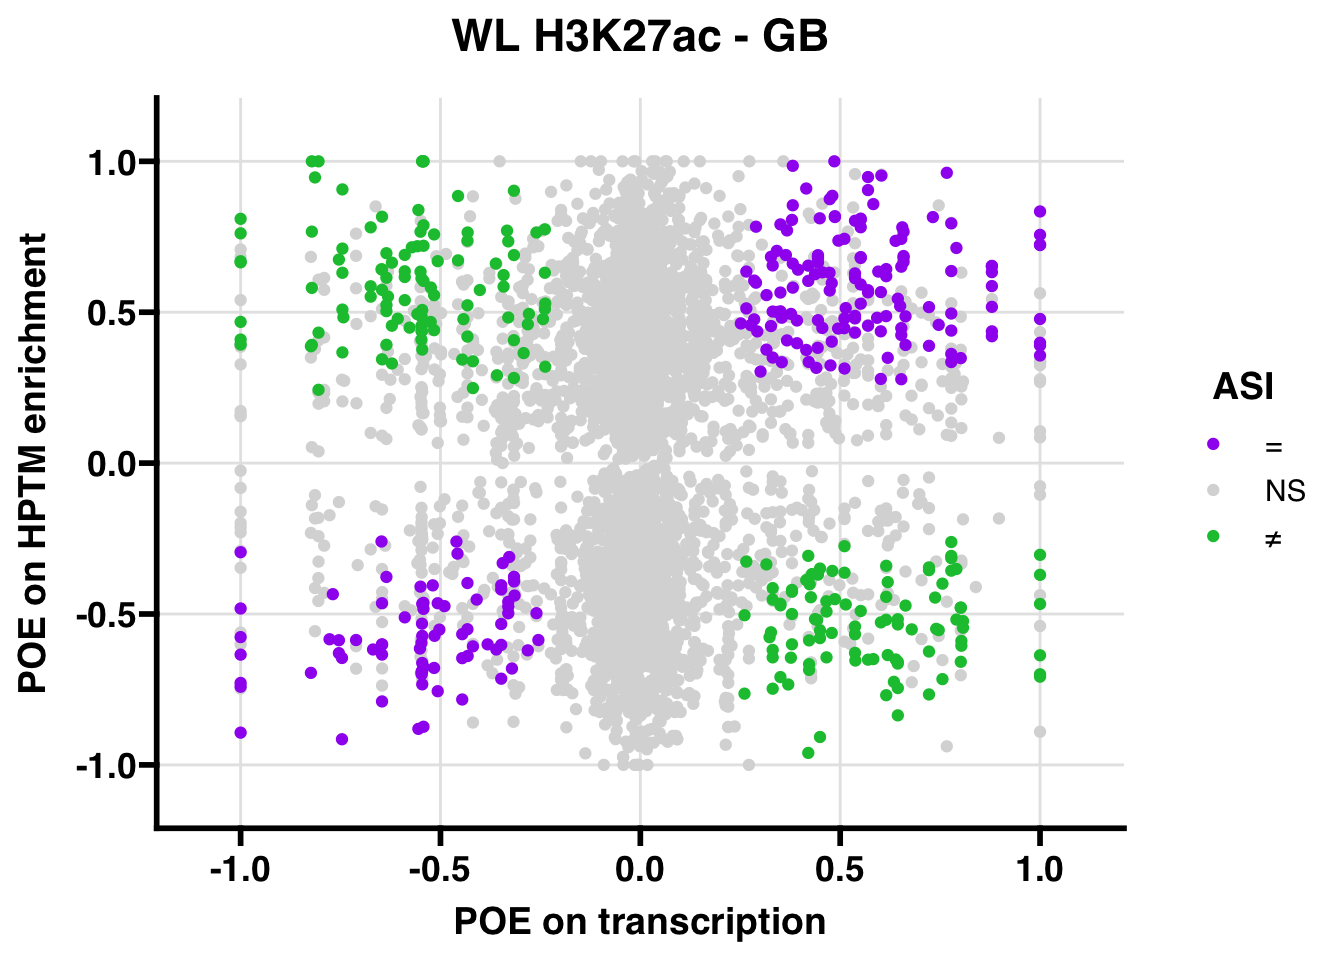
QL
Gene:Peak (categories of allelic bias)
##
## Lineage B:Lineage A       Lineage B:mat        Lineage B:NA       Lineage B:pat
##                   6                   2                  17                   5
##       mat:Lineage A       mat:Lineage B             mat:mat              mat:NA
##                   3                   2                   2                  25
##             mat:pat        NA:Lineage A        NA:Lineage B              NA:mat
##                  17                 605                 613                 950
##               NA:NA              NA:pat       pat:Lineage A       pat:Lineage B
##                5427                3388                   8                   5
##             pat:mat              pat:NA             pat:pat
##                   8                  64                  84
Summary of overlaps (00 = neither peak nor gene biased, 01 = gene unbiased, peak biased, 10 = gene biased, peak unbiased, 11 = both gene and peak show allelic bias)
##
##    00    01    10    11
## 10757    32    93   111
Fishers exact test of enrichment (do genes showing allelic bias overlap with peaks showing allelic bias)?
##
##  Fisher's Exact Test for Count Data
##
## data:  data.frame(x = c(tab[4], tab[3]), y = c(tab[2], tab[1]))
## p-value < 2.2e-16
## alternative hypothesis: true odds ratio is greater than 1
## 95 percent confidence interval:
##  269.4737      Inf
## sample estimates:
## odds ratio
##   397.5212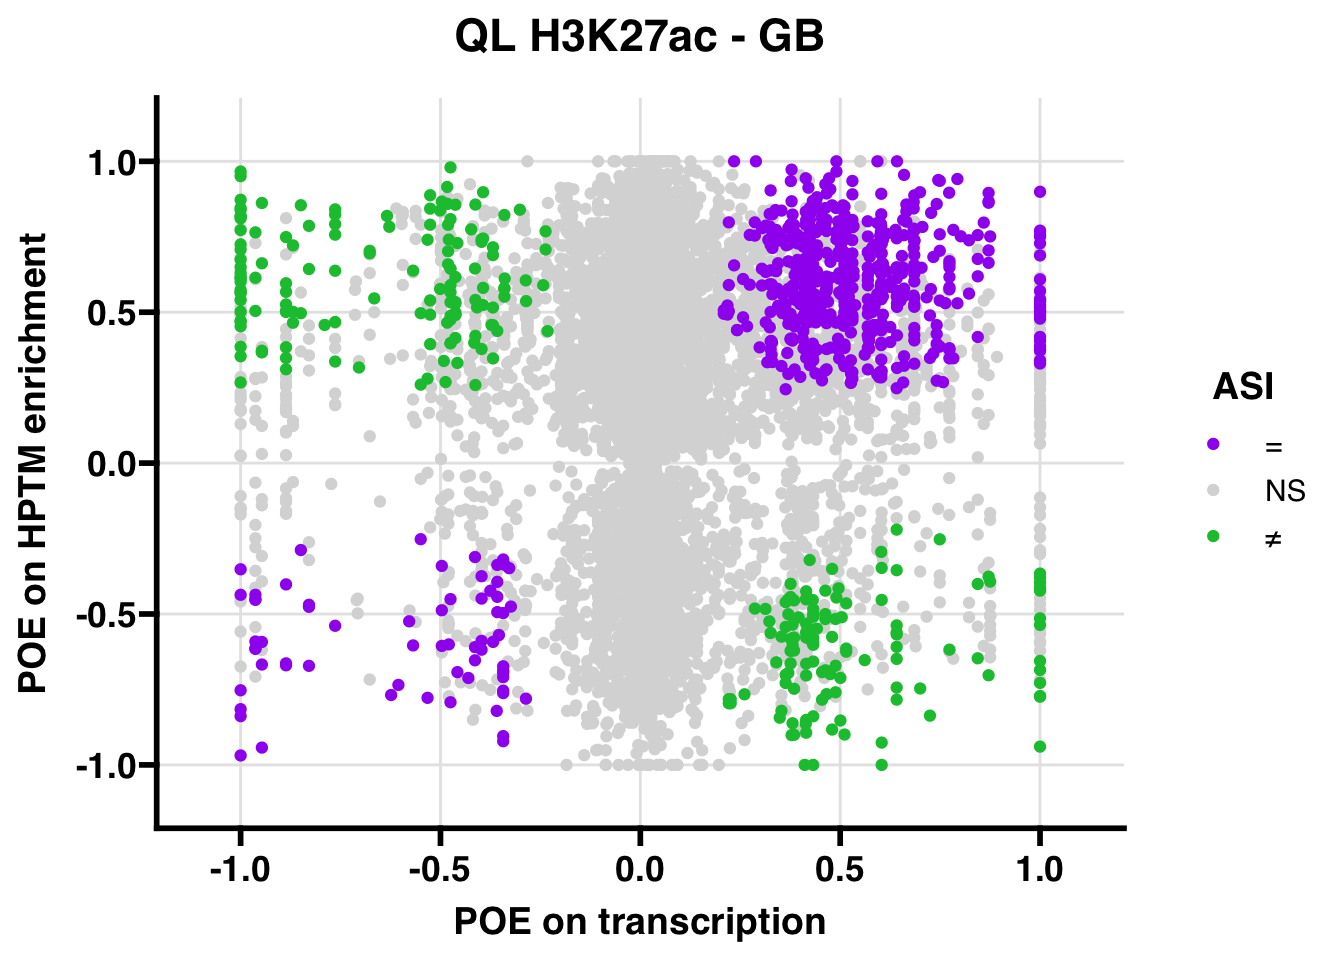
Promoter
WL
Gene:Peak (categories of allelic bias)
##
##      mat:mat       mat:NA      mat:pat NA:Lineage A NA:Lineage B       NA:mat
##            2            4            3           59           63          156
##        NA:NA       NA:pat      pat:mat       pat:NA      pat:pat
##          569          192            3            9            3
Summary of overlaps (00 = neither peak nor gene biased, 01 = gene unbiased, peak biased, 10 = gene biased, peak unbiased, 11 = both gene and peak show allelic bias)
##
##   00   01   10   11
## 1022    4    3   11
Fishers exact test of enrichment (do genes showing allelic bias overlap with peaks showing allelic bias)?
##
##  Fisher's Exact Test for Count Data
##
## data:  data.frame(x = c(tab[4], tab[3]), y = c(tab[2], tab[1]))
## p-value < 2.2e-16
## alternative hypothesis: true odds ratio is greater than 1
## 95 percent confidence interval:
##  189.0323      Inf
## sample estimates:
## odds ratio
##   830.8785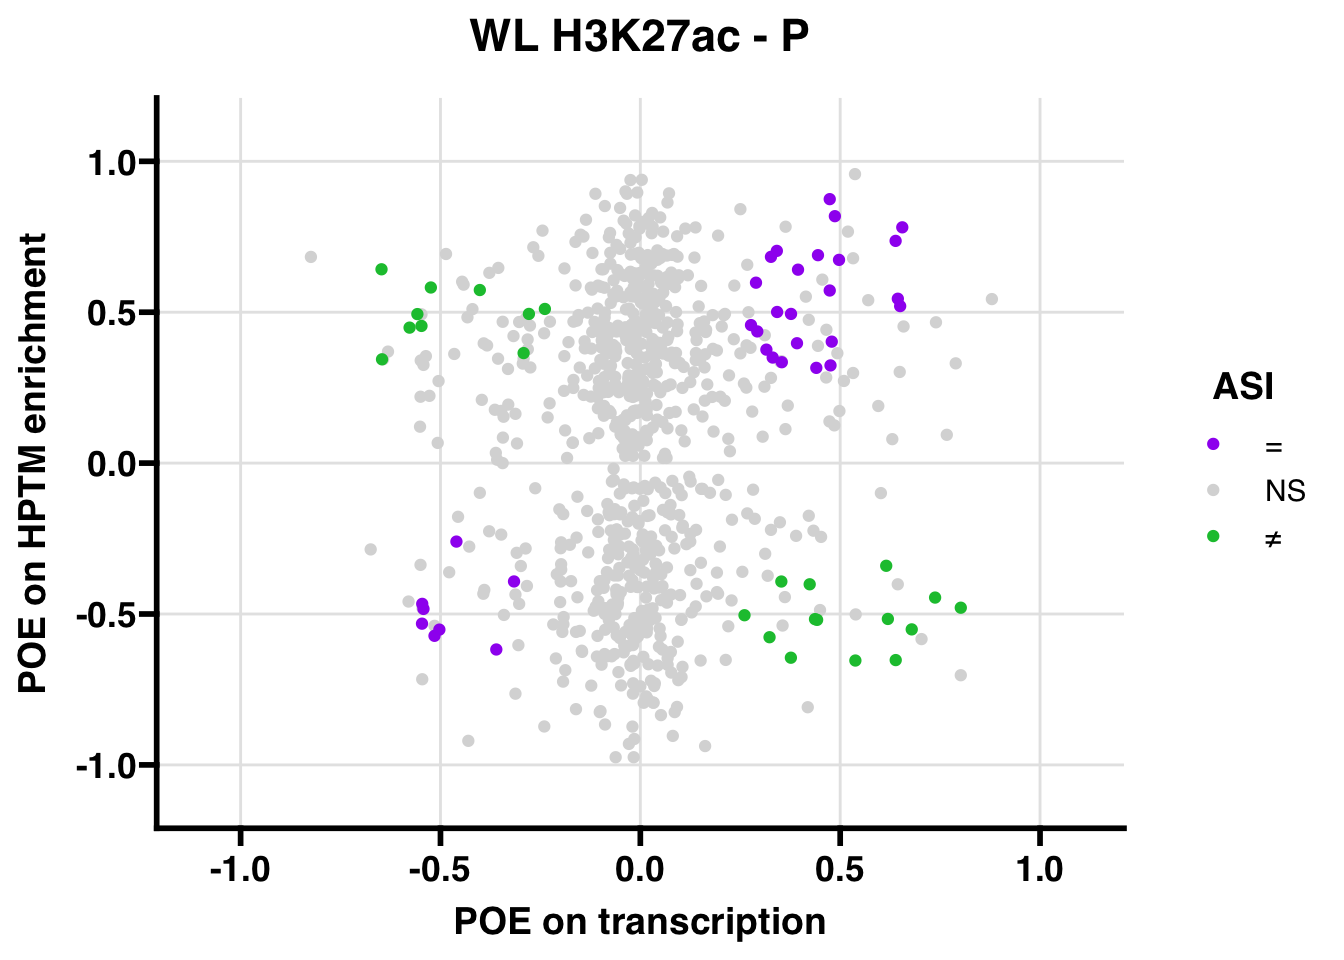
QL
Gene:Peak (categories of allelic bias)
##
## Lineage B:pat        mat:NA       mat:pat  NA:Lineage A  NA:Lineage B
##             1             1             5            99            92
##        NA:mat         NA:NA        NA:pat pat:Lineage A pat:Lineage B
##           157           875           568             2             1
##        pat:NA       pat:pat
##            16            22
Summary of overlaps (00 = neither peak nor gene biased, 01 = gene unbiased, peak biased, 10 = gene biased, peak unbiased, 11 = both gene and peak show allelic bias)
##
##   00   01   10   11
## 1762    4    3   27
Fishers exact test of enrichment (do genes showing allelic bias overlap with peaks showing allelic bias)?
##
##  Fisher's Exact Test for Count Data
##
## data:  data.frame(x = c(tab[4], tab[3]), y = c(tab[2], tab[1]))
## p-value < 2.2e-16
## alternative hypothesis: true odds ratio is greater than 1
## 95 percent confidence interval:
##  857.3396      Inf
## sample estimates:
## odds ratio
##   3358.251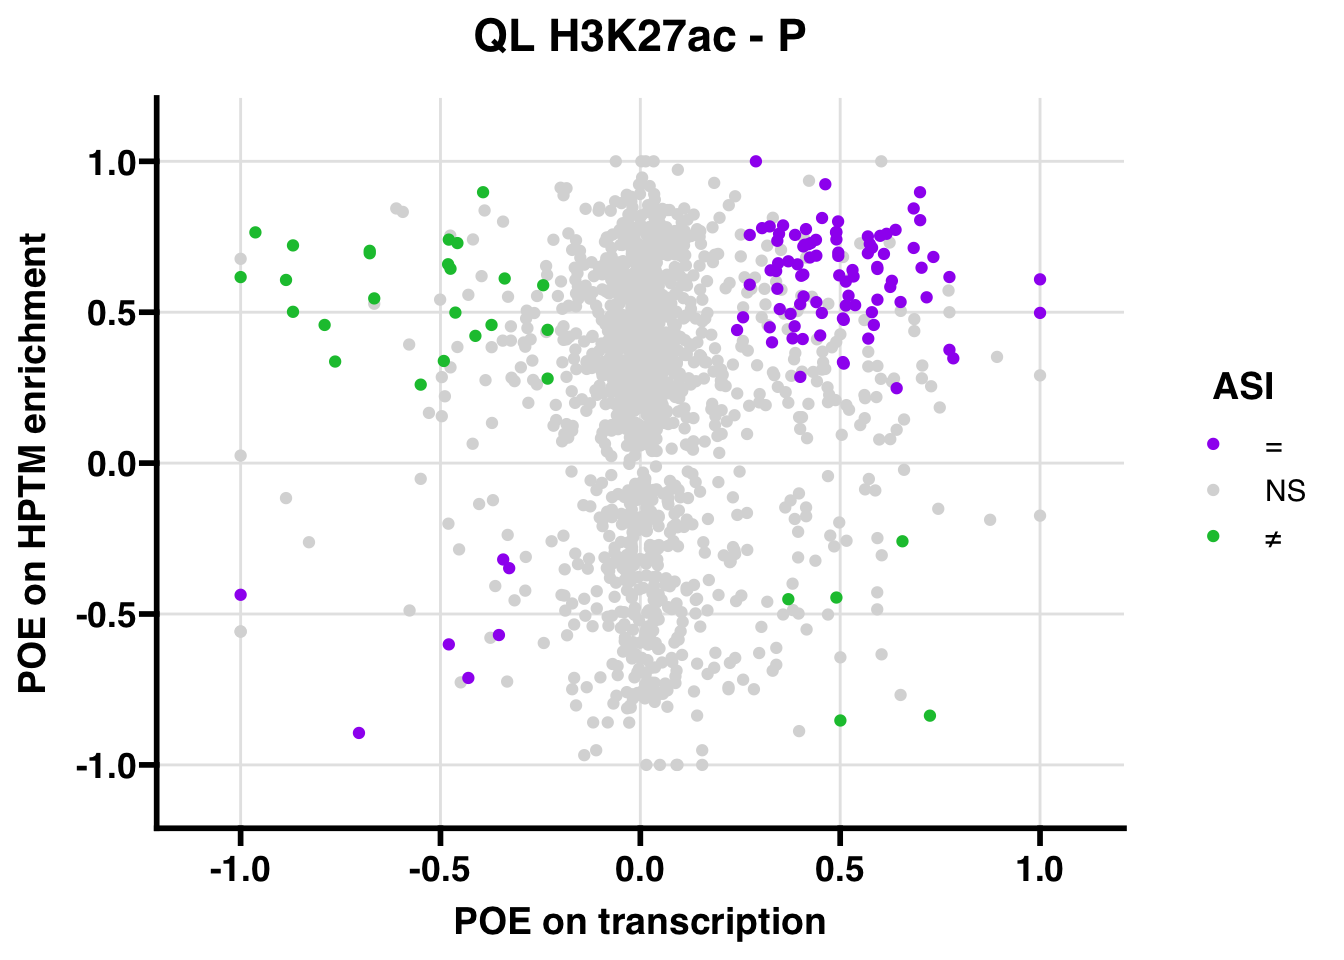
H3K4me3
Gene body
WL
Gene:Peak (categories of allelic bias)
##
## Lineage B:mat  Lineage B:NA Lineage B:pat mat:Lineage A mat:Lineage B
##             2             7             3             5             1
##       mat:mat        mat:NA       mat:pat  NA:Lineage A  NA:Lineage B
##            15            50            21           304           360
##        NA:mat         NA:NA        NA:pat pat:Lineage A pat:Lineage B
##          1432          4824          2141             3             8
##       pat:mat        pat:NA       pat:pat
##            37            84            33
Summary of overlaps (00 = neither peak nor gene biased, 01 = gene unbiased, peak biased, 10 = gene biased, peak unbiased, 11 = both gene and peak show allelic bias)
##
##   00   01   10   11
## 8806   27  127  106
Fishers exact test of enrichment (do genes showing allelic bias overlap with peaks showing allelic bias)?
##
##  Fisher's Exact Test for Count Data
##
## data:  data.frame(x = c(tab[4], tab[3]), y = c(tab[2], tab[1]))
## p-value < 2.2e-16
## alternative hypothesis: true odds ratio is greater than 1
## 95 percent confidence interval:
##  180.7667      Inf
## sample estimates:
## odds ratio
##   268.7595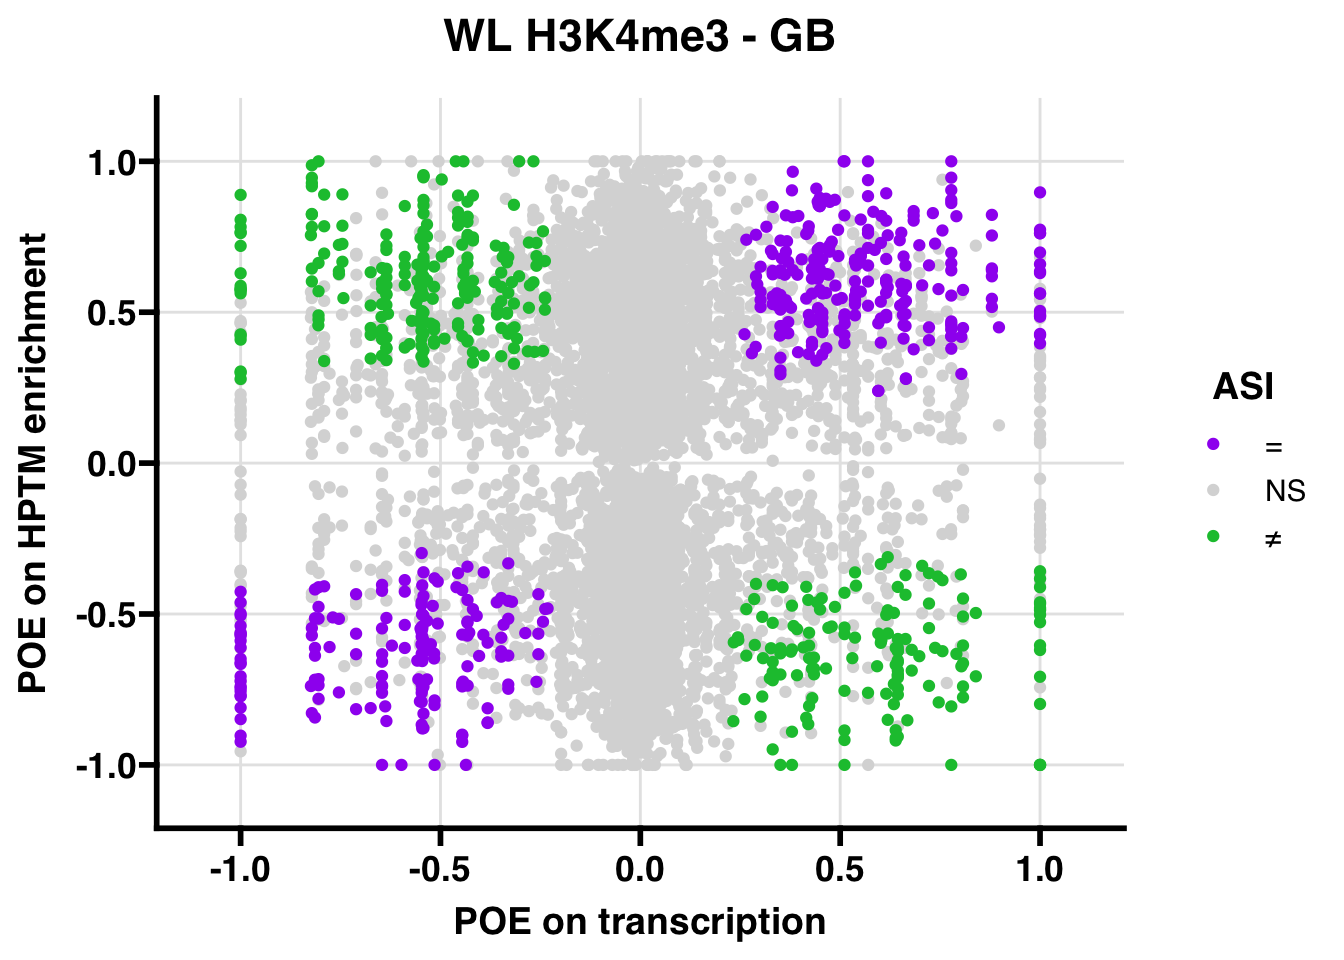
QL
Gene:Peak (categories of allelic bias)
##
## Lineage B:Lineage A Lineage B:Lineage B       Lineage B:mat        Lineage B:NA
##                   1                   3                   4                  18
##       Lineage B:pat       mat:Lineage B              mat:NA             mat:pat
##                   5                   1                  22                  19
##        NA:Lineage A        NA:Lineage B              NA:mat               NA:NA
##                 382                 422                1003                5775
##              NA:pat       pat:Lineage A       pat:Lineage B             pat:mat
##                3836                   3                   4                   5
##              pat:NA             pat:pat
##                  79                  89
Summary of overlaps (00 = neither peak nor gene biased, 01 = gene unbiased, peak biased, 10 = gene biased, peak unbiased, 11 = both gene and peak show allelic bias)
##
##    00    01    10    11
## 11206    25    81   113
Fishers exact test of enrichment (do genes showing allelic bias overlap with peaks showing allelic bias)?
##
##  Fisher's Exact Test for Count Data
##
## data:  data.frame(x = c(tab[4], tab[3]), y = c(tab[2], tab[1]))
## p-value < 2.2e-16
## alternative hypothesis: true odds ratio is greater than 1
## 95 percent confidence interval:
##  405.6765      Inf
## sample estimates:
## odds ratio
##   609.4468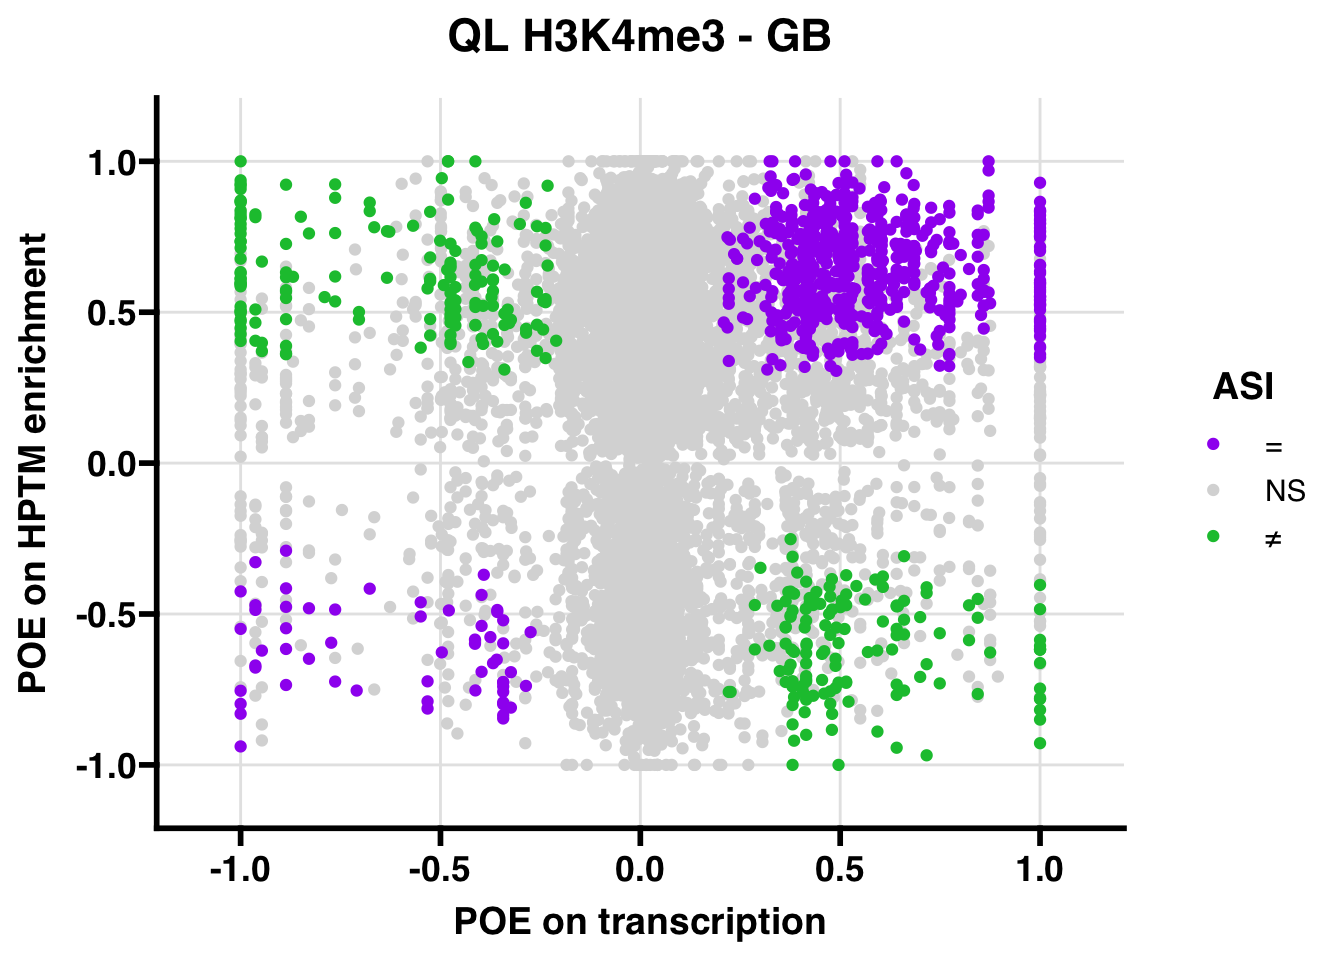
Promoter
WL
Gene:Peak (categories of allelic bias)
##
## Lineage B:mat       mat:mat        mat:NA       mat:pat  NA:Lineage A
##             1             1             5             3            73
##  NA:Lineage B        NA:mat         NA:NA        NA:pat pat:Lineage A
##            50           247           781           363             1
##       pat:mat        pat:NA       pat:pat
##             4             6            10
Summary of overlaps (00 = neither peak nor gene biased, 01 = gene unbiased, peak biased, 10 = gene biased, peak unbiased, 11 = both gene and peak show allelic bias)
##
##   00   01   10   11
## 1490    7    1   18
Fishers exact test of enrichment (do genes showing allelic bias overlap with peaks showing allelic bias)?
##
##  Fisher's Exact Test for Count Data
##
## data:  data.frame(x = c(tab[4], tab[3]), y = c(tab[2], tab[1]))
## p-value < 2.2e-16
## alternative hypothesis: true odds ratio is greater than 1
## 95 percent confidence interval:
##  538.9474      Inf
## sample estimates:
## odds ratio
##    3621.27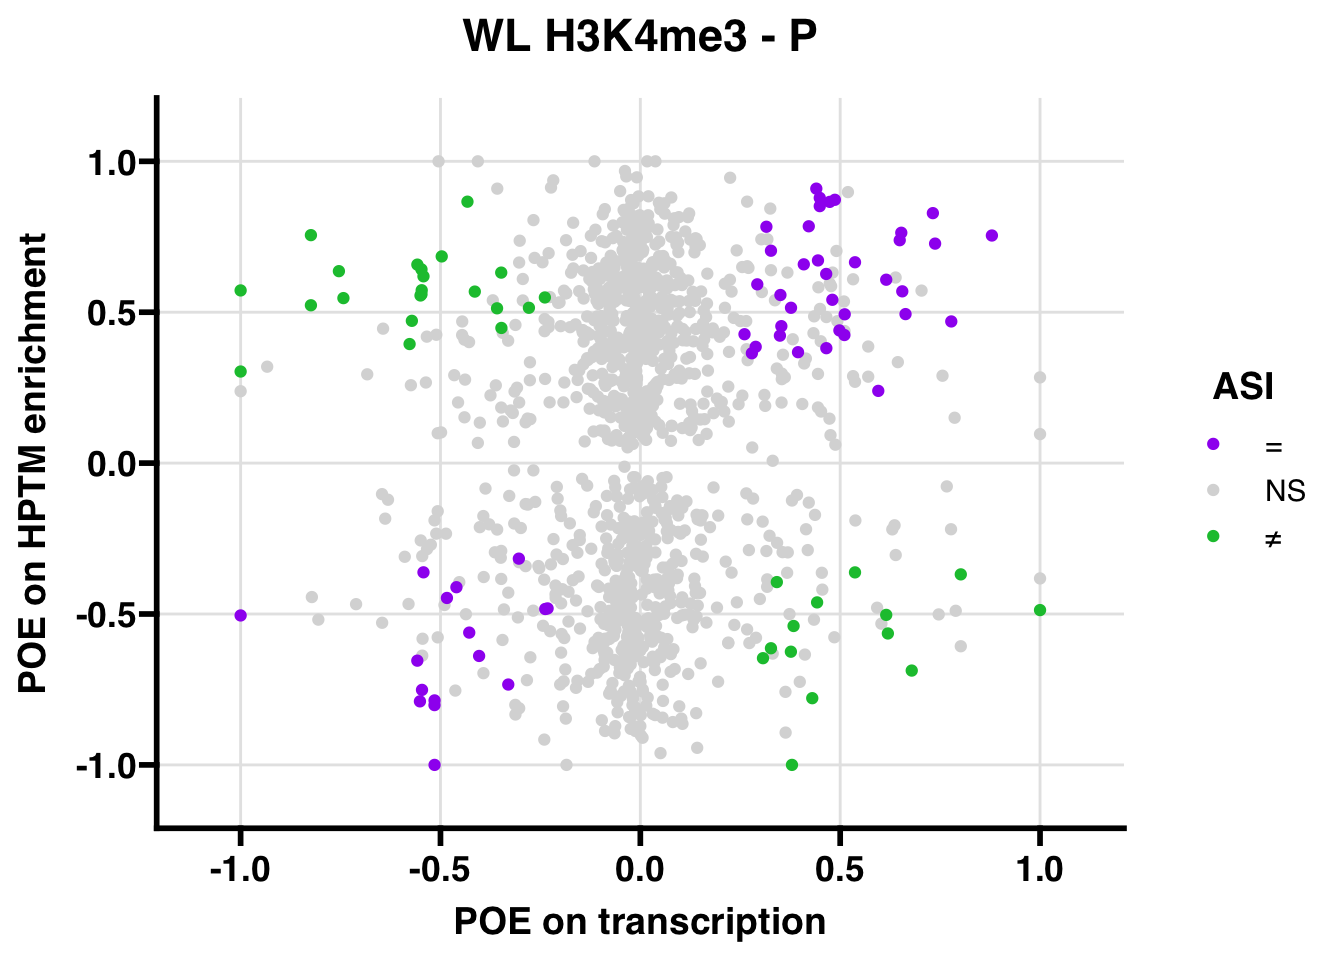
QL
Gene:Peak (categories of allelic bias)
##
##  Lineage B:NA        mat:NA       mat:pat  NA:Lineage A  NA:Lineage B
##             2             2             6            66            69
##        NA:mat         NA:NA        NA:pat pat:Lineage A       pat:mat
##           132           925           645             1             4
##        pat:NA       pat:pat
##            15            17
Summary of overlaps (00 = neither peak nor gene biased, 01 = gene unbiased, peak biased, 10 = gene biased, peak unbiased, 11 = both gene and peak show allelic bias)
##
##   00   01   10   11
## 1801    9    5   27
Fishers exact test of enrichment (do genes showing allelic bias overlap with peaks showing allelic bias)?
##
##  Fisher's Exact Test for Count Data
##
## data:  data.frame(x = c(tab[4], tab[3]), y = c(tab[2], tab[1]))
## p-value < 2.2e-16
## alternative hypothesis: true odds ratio is greater than 1
## 95 percent confidence interval:
##  354.8727      Inf
## sample estimates:
## odds ratio
##   1042.272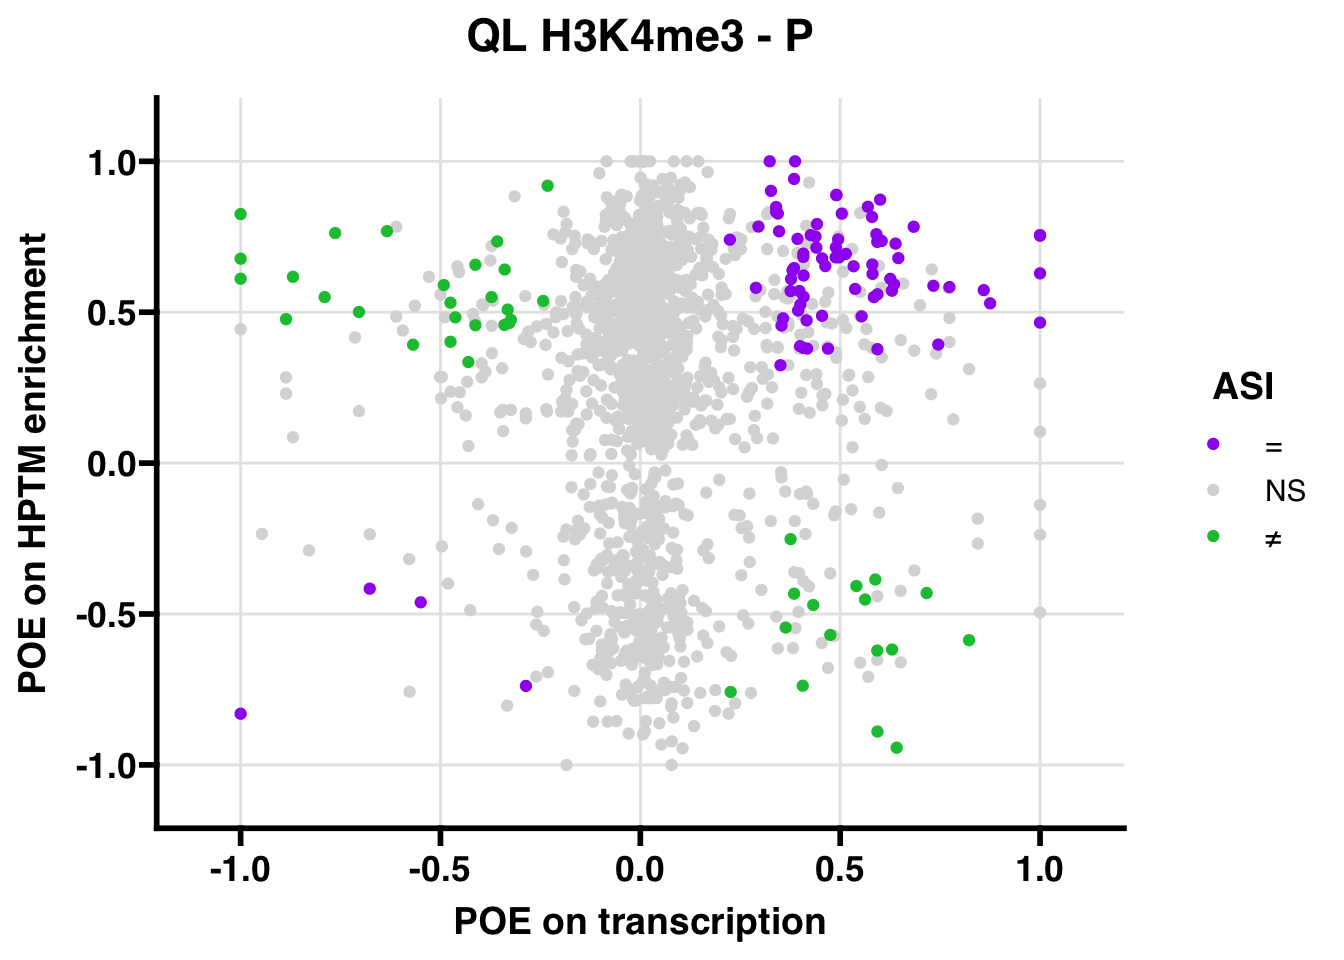
7.3 Logistic regression
H3K27me3 (gene body)
##
## Call:
## glm(formula = OVERLAP.y ~ OVERLAP.x + Group, family = "binomial",
##     data = comp.df.sub, na.action = na.exclude)
##
## Coefficients:
##             Estimate Std. Error z value Pr(>|z|)
## (Intercept) -5.82864    0.10454 -55.756   <2e-16 ***
## OVERLAP.x    5.70436    0.10300  55.381   <2e-16 ***
## Groupb1W    -0.24667    0.10946  -2.253   0.0242 *
## Groupb2Q    -0.04658    0.13386  -0.348   0.7279
## Groupb2W    -0.26907    0.13136  -2.048   0.0405 *
## ---
## Signif. codes:  0 '***' 0.001 '**' 0.01 '*' 0.05 '.' 0.1 ' ' 1
##
## (Dispersion parameter for binomial family taken to be 1)
##
##     Null deviance: 8323.7  on 50920  degrees of freedom
## Residual deviance: 3910.9  on 50916  degrees of freedom
## AIC: 3920.9
##
## Number of Fisher Scoring iterations: 8
## OR 2.5 % 97.5 %
## (Intercept) 2.942083e-03 2.385536e-03 3.594559e-03
## OVERLAP.x 3.001724e+02 2.461635e+02 3.687337e+02
## Groupb1W 7.813985e-01 6.299726e-01 9.677082e-01
## Groupb2Q 9.544874e-01 7.327419e-01 1.238843e+00
## Groupb2W 7.640882e-01 5.893171e-01 9.865526e-01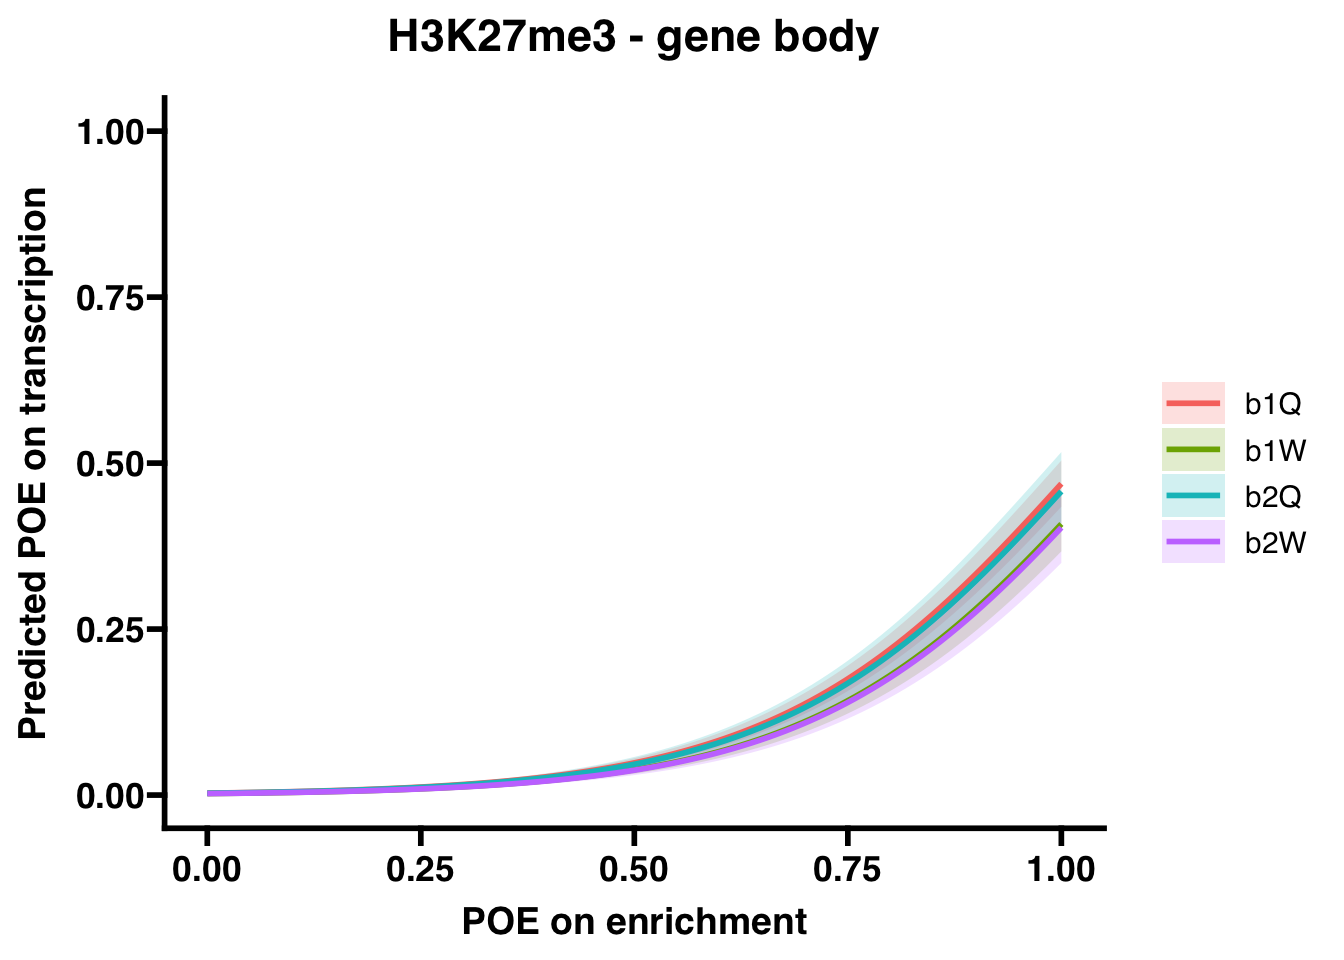
H3K27me3 (promoter)
##
## Call:
## glm(formula = OVERLAP.y ~ OVERLAP.x + Group, family = "binomial",
##     data = comp.df.sub, na.action = na.exclude)
##
## Coefficients:
##             Estimate Std. Error z value Pr(>|z|)
## (Intercept) -5.75549    0.31152 -18.476   <2e-16 ***
## OVERLAP.x    7.52828    0.34261  21.973   <2e-16 ***
## Groupb1W    -0.26110    0.41729  -0.626    0.532
## Groupb2Q    -0.53716    0.45621  -1.177    0.239
## Groupb2W    -0.06581    0.52996  -0.124    0.901
## ---
## Signif. codes:  0 '***' 0.001 '**' 0.01 '*' 0.05 '.' 0.1 ' ' 1
##
## (Dispersion parameter for binomial family taken to be 1)
##
##     Null deviance: 1233.94  on 7353  degrees of freedom
## Residual deviance:  374.64  on 7349  degrees of freedom
## AIC: 384.64
##
## Number of Fisher Scoring iterations: 8
## OR 2.5 % 97.5 %
## (Intercept) 3.165344e-03 0.00163964 5.583912e-03
## OVERLAP.x 1.859898e+03 979.24688378 3.769529e+03
## Groupb1W 7.702022e-01 0.33622761 1.742170e+00
## Groupb2Q 5.844072e-01 0.23538931 1.418525e+00
## Groupb2W 9.363044e-01 0.31627339 2.563678e+00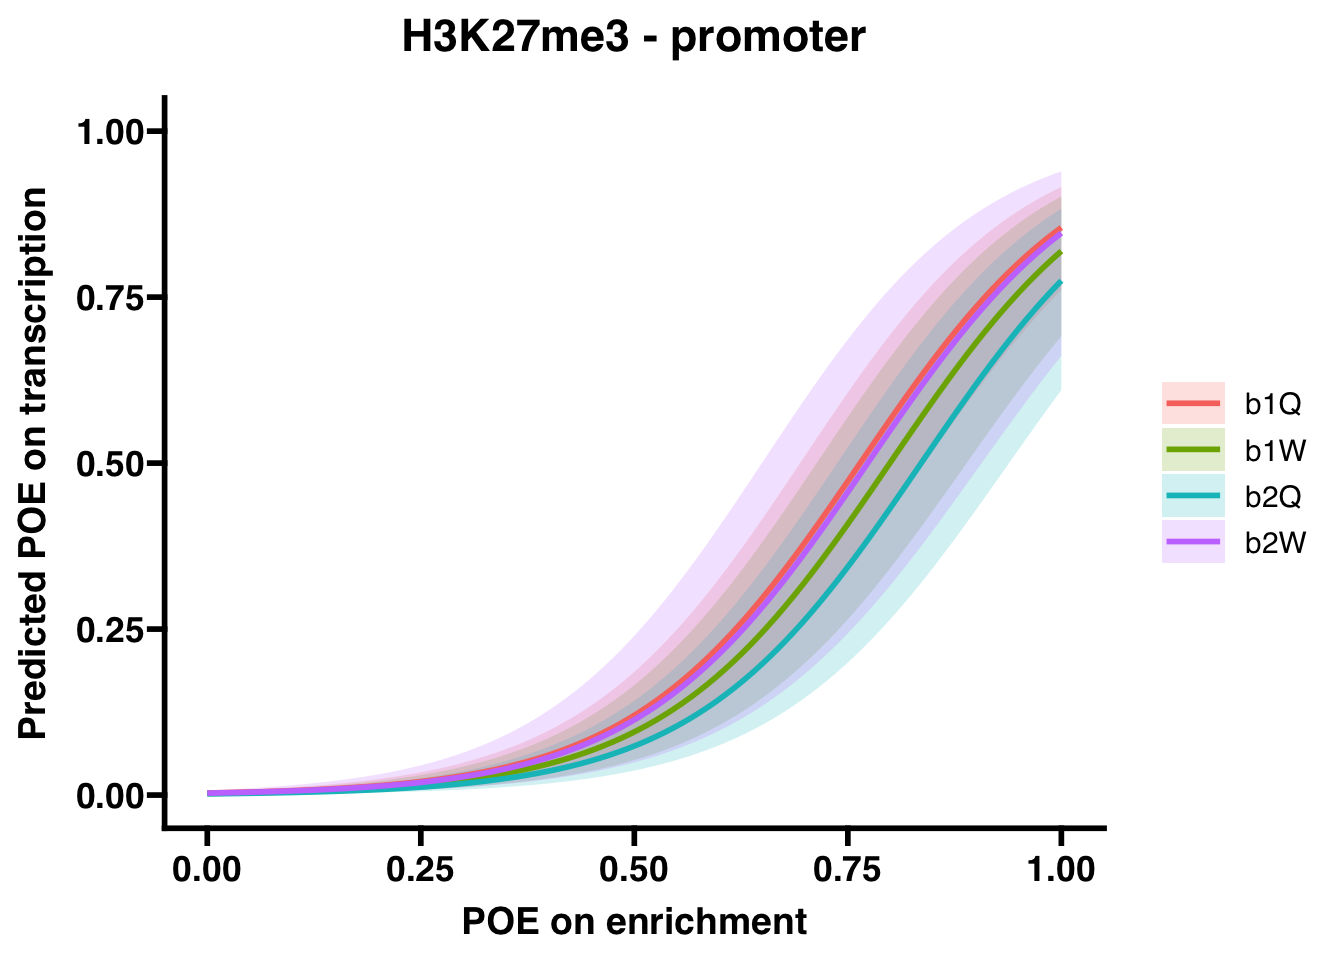
H3K27ac (gene body)
##
## Call:
## glm(formula = OVERLAP.y ~ OVERLAP.x + Group, family = "binomial",
##     data = comp.df.sub, na.action = na.exclude)
##
## Coefficients:
##             Estimate Std. Error z value Pr(>|z|)
## (Intercept) -5.68839    0.09942 -57.217   <2e-16 ***
## OVERLAP.x    5.62249    0.09830  57.197   <2e-16 ***
## Groupb1W    -0.20618    0.10566  -1.951    0.051 .
## Groupb2Q     0.08954    0.12566   0.713    0.476
## Groupb2W    -0.12049    0.15052  -0.801    0.423
## ---
## Signif. codes:  0 '***' 0.001 '**' 0.01 '*' 0.05 '.' 0.1 ' ' 1
##
## (Dispersion parameter for binomial family taken to be 1)
##
##     Null deviance: 8533.4  on 47753  degrees of freedom
## Residual deviance: 4071.8  on 47749  degrees of freedom
## AIC: 4081.8
##
## Number of Fisher Scoring iterations: 8
## OR 2.5 % 97.5 %
## (Intercept) 3.385034e-03 2.773866e-03 4.096361e-03
## OVERLAP.x 2.765771e+02 2.287886e+02 3.364209e+02
## Groupb1W 8.136896e-01 6.610398e-01 1.000369e+00
## Groupb2Q 1.093668e+00 8.538520e-01 1.397763e+00
## Groupb2W 8.864828e-01 6.578226e-01 1.187315e+00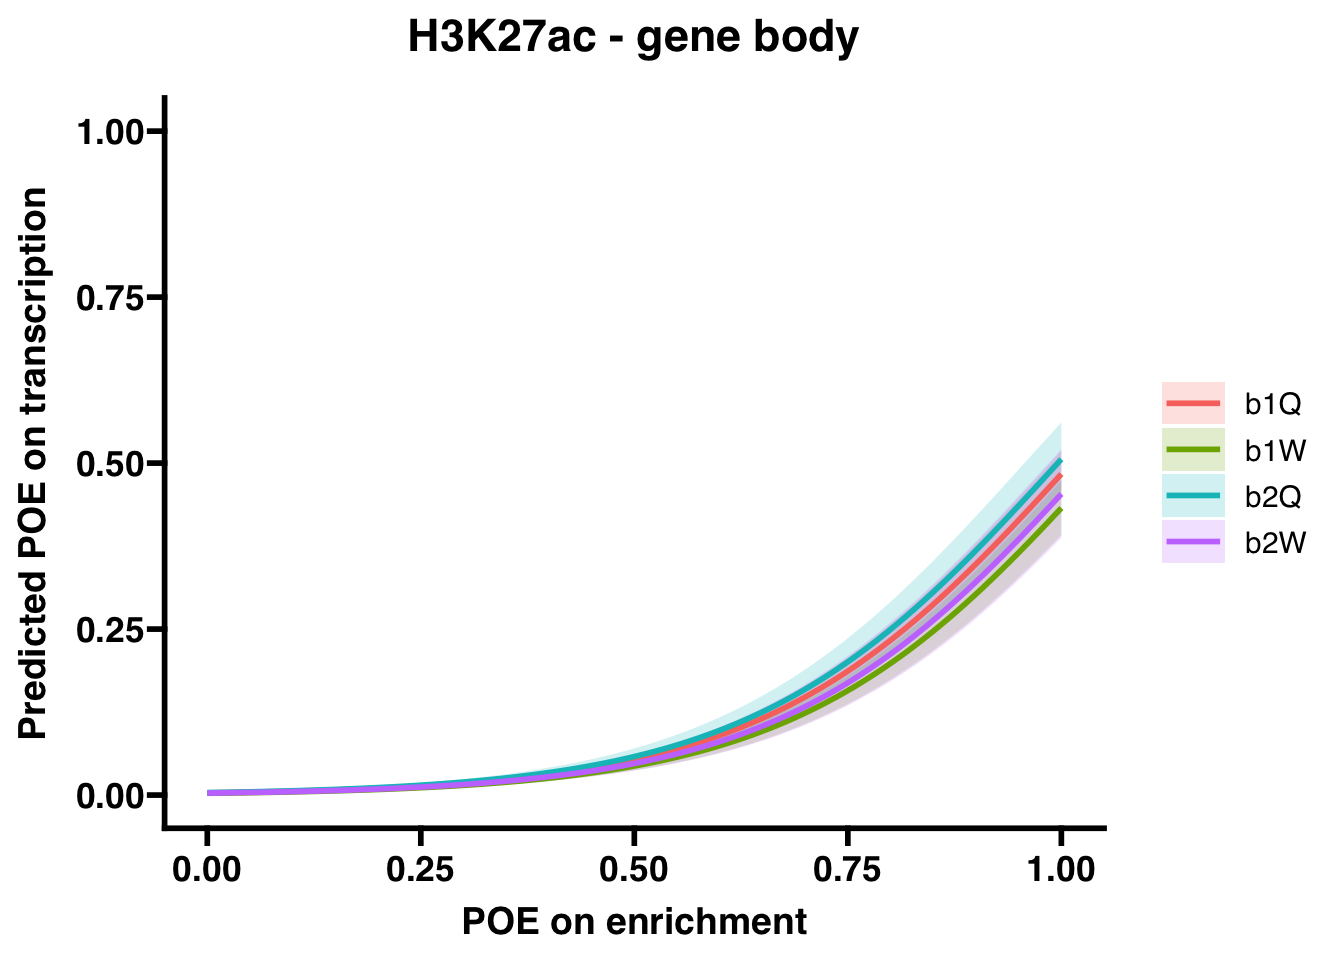
H3K27ac (promoter)
##
## Call:
## glm(formula = OVERLAP.y ~ OVERLAP.x + Group, family = "binomial",
##     data = comp.df.sub, na.action = na.exclude)
##
## Coefficients:
##             Estimate Std. Error z value Pr(>|z|)
## (Intercept) -5.63126    0.28548 -19.726   <2e-16 ***
## OVERLAP.x    7.12448    0.29693  23.994   <2e-16 ***
## Groupb1W    -0.04749    0.36865  -0.129    0.898
## Groupb2Q     0.01817    0.39244   0.046    0.963
## Groupb2W    -0.01675    0.48733  -0.034    0.973
## ---
## Signif. codes:  0 '***' 0.001 '**' 0.01 '*' 0.05 '.' 0.1 ' ' 1
##
## (Dispersion parameter for binomial family taken to be 1)
##
##     Null deviance: 1360.28  on 7500  degrees of freedom
## Residual deviance:  474.87  on 7496  degrees of freedom
## AIC: 484.87
##
## Number of Fisher Scoring iterations: 8
## OR 2.5 % 97.5 %
## (Intercept) 3.584039e-03 1.975511e-03 6.060581e-03
## OVERLAP.x 1.242006e+03 7.086525e+02 2.275533e+03
## Groupb1W 9.536245e-01 4.608848e-01 1.968569e+00
## Groupb2Q 1.018332e+00 4.687536e-01 2.197517e+00
## Groupb2W 9.833923e-01 3.694404e-01 2.502751e+00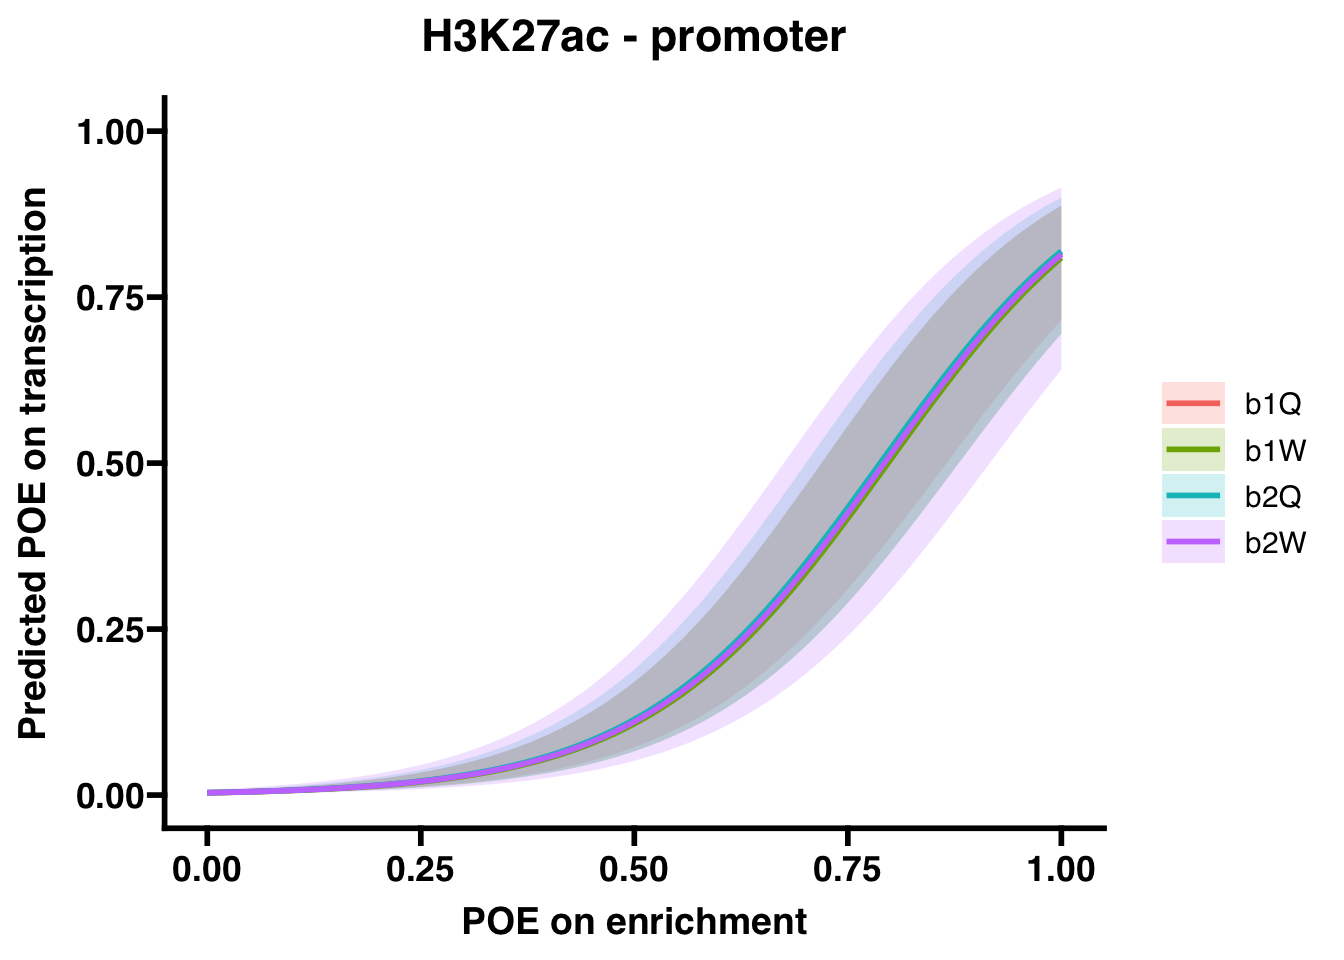
H3K4me3 (gene body)
##
## Call:
## glm(formula = OVERLAP.y ~ OVERLAP.x + Group, family = "binomial",
##     data = comp.df.sub, na.action = na.exclude)
##
## Coefficients:
##              Estimate Std. Error z value Pr(>|z|)
## (Intercept) -6.089231   0.118185 -51.523   <2e-16 ***
## OVERLAP.x    6.041222   0.112453  53.722   <2e-16 ***
## Groupb1W    -0.209966   0.117669  -1.784   0.0744 .
## Groupb2Q     0.233025   0.135792   1.716   0.0862 .
## Groupb2W    -0.008768   0.134921  -0.065   0.9482
## ---
## Signif. codes:  0 '***' 0.001 '**' 0.01 '*' 0.05 '.' 0.1 ' ' 1
##
## (Dispersion parameter for binomial family taken to be 1)
##
##     Null deviance: 8136.4  on 48209  degrees of freedom
## Residual deviance: 3495.8  on 48205  degrees of freedom
## AIC: 3505.8
##
## Number of Fisher Scoring iterations: 8
## OR 2.5 % 97.5 %
## (Intercept) 2.267151e-03 1.788273e-03 2.842929e-03
## OVERLAP.x 4.204063e+02 3.387469e+02 5.266395e+02
## Groupb1W 8.106115e-01 6.431508e-01 1.020280e+00
## Groupb2Q 1.262412e+00 9.667989e-01 1.646939e+00
## Groupb2W 9.912702e-01 7.600011e-01 1.290169e+00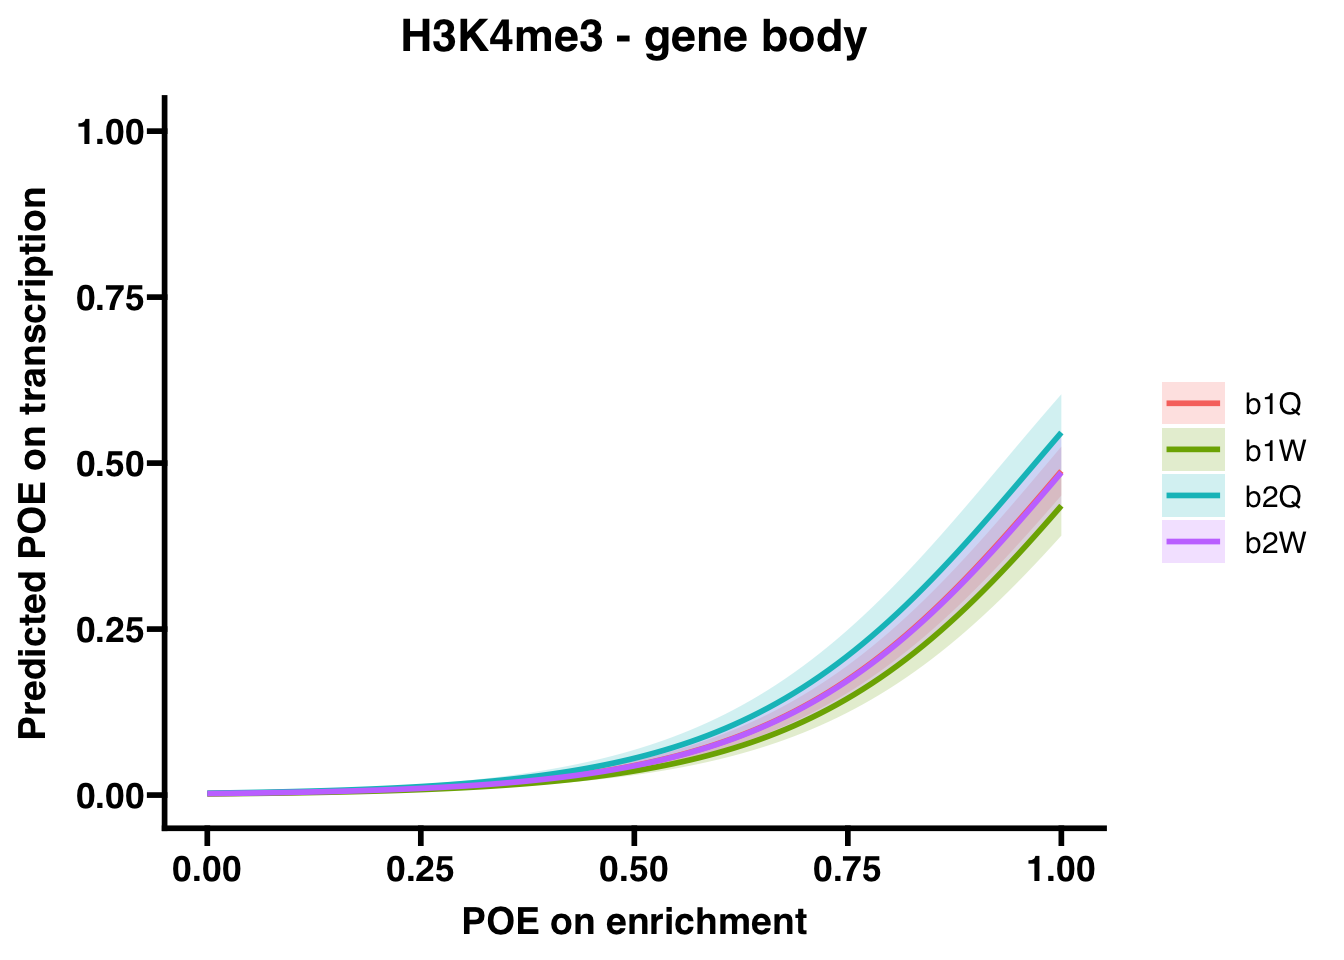
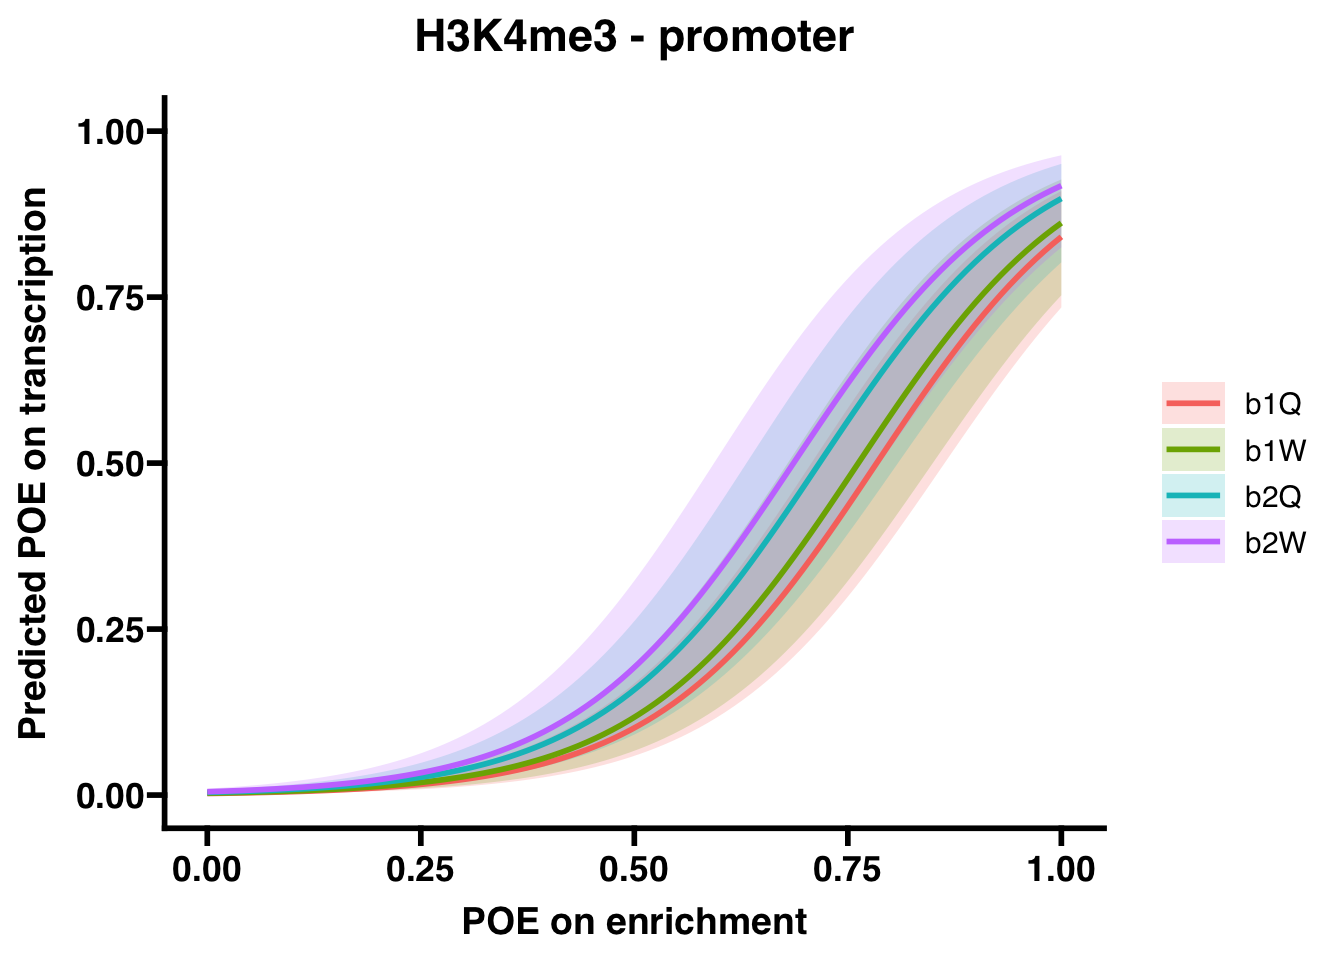
H3K4me3 (promoter)
##
## Call:
## glm(formula = OVERLAP.y ~ OVERLAP.x + Group, family = "binomial",
##     data = comp.df.sub, na.action = na.exclude)
##
## Coefficients:
##             Estimate Std. Error z value Pr(>|z|)
## (Intercept)  -6.0322     0.3567 -16.910   <2e-16 ***
## OVERLAP.x     7.6968     0.3422  22.495   <2e-16 ***
## Groupb1W      0.1652     0.4352   0.380    0.704
## Groupb2Q      0.5159     0.4434   1.164    0.245
## Groupb2W      0.7490     0.4693   1.596    0.110
## ---
## Signif. codes:  0 '***' 0.001 '**' 0.01 '*' 0.05 '.' 0.1 ' ' 1
##
## (Dispersion parameter for binomial family taken to be 1)
##
##     Null deviance: 1433.79  on 7359  degrees of freedom
## Residual deviance:  437.22  on 7355  degrees of freedom
## AIC: 447.22
##
## Number of Fisher Scoring iterations: 8
## OR 2.5 % 97.5 %
## (Intercept) 2.400151e-03 1.134377e-03 4.603934e-03
## OVERLAP.x 2.201259e+03 1.163417e+03 4.474247e+03
## Groupb1W 1.179619e+00 5.026020e-01 2.796025e+00
## Groupb2Q 1.675221e+00 7.069031e-01 4.063030e+00
## Groupb2W 2.114952e+00 8.439543e-01 5.373705e+00