S5 Allele-Specific ChIP-seq Analyses
5.1 SNPs and peaks
| HPTM | Block | Caste | SNPs | Peaks | SNPs per Peak |
|---|---|---|---|---|---|
| H3K27me3 | 1 | WL | 79473 | 14160 | 5.61 |
| H3K27me3 | 1 | QL | 82753 | 19814 | 4.18 |
| H3K27me3 | 2 | WL | 61556 | 10919 | 5.64 |
| H3K27me3 | 2 | QL | 73681 | 12119 | 6.08 |
| H3K27ac | 1 | WL | 85908 | 15148 | 5.67 |
| H3K27ac | 1 | QL | 90950 | 19701 | 4.62 |
| H3K27ac | 2 | WL | 27763 | 6140 | 4.52 |
| H3K27ac | 2 | QL | 55079 | 12344 | 4.46 |
| H3K4me3 | 1 | WL | 66288 | 14356 | 4.62 |
| H3K4me3 | 1 | QL | 65804 | 17152 | 3.84 |
| H3K4me3 | 2 | WL | 51650 | 10242 | 5.04 |
| H3K4me3 | 2 | QL | 58502 | 13038 | 4.49 |
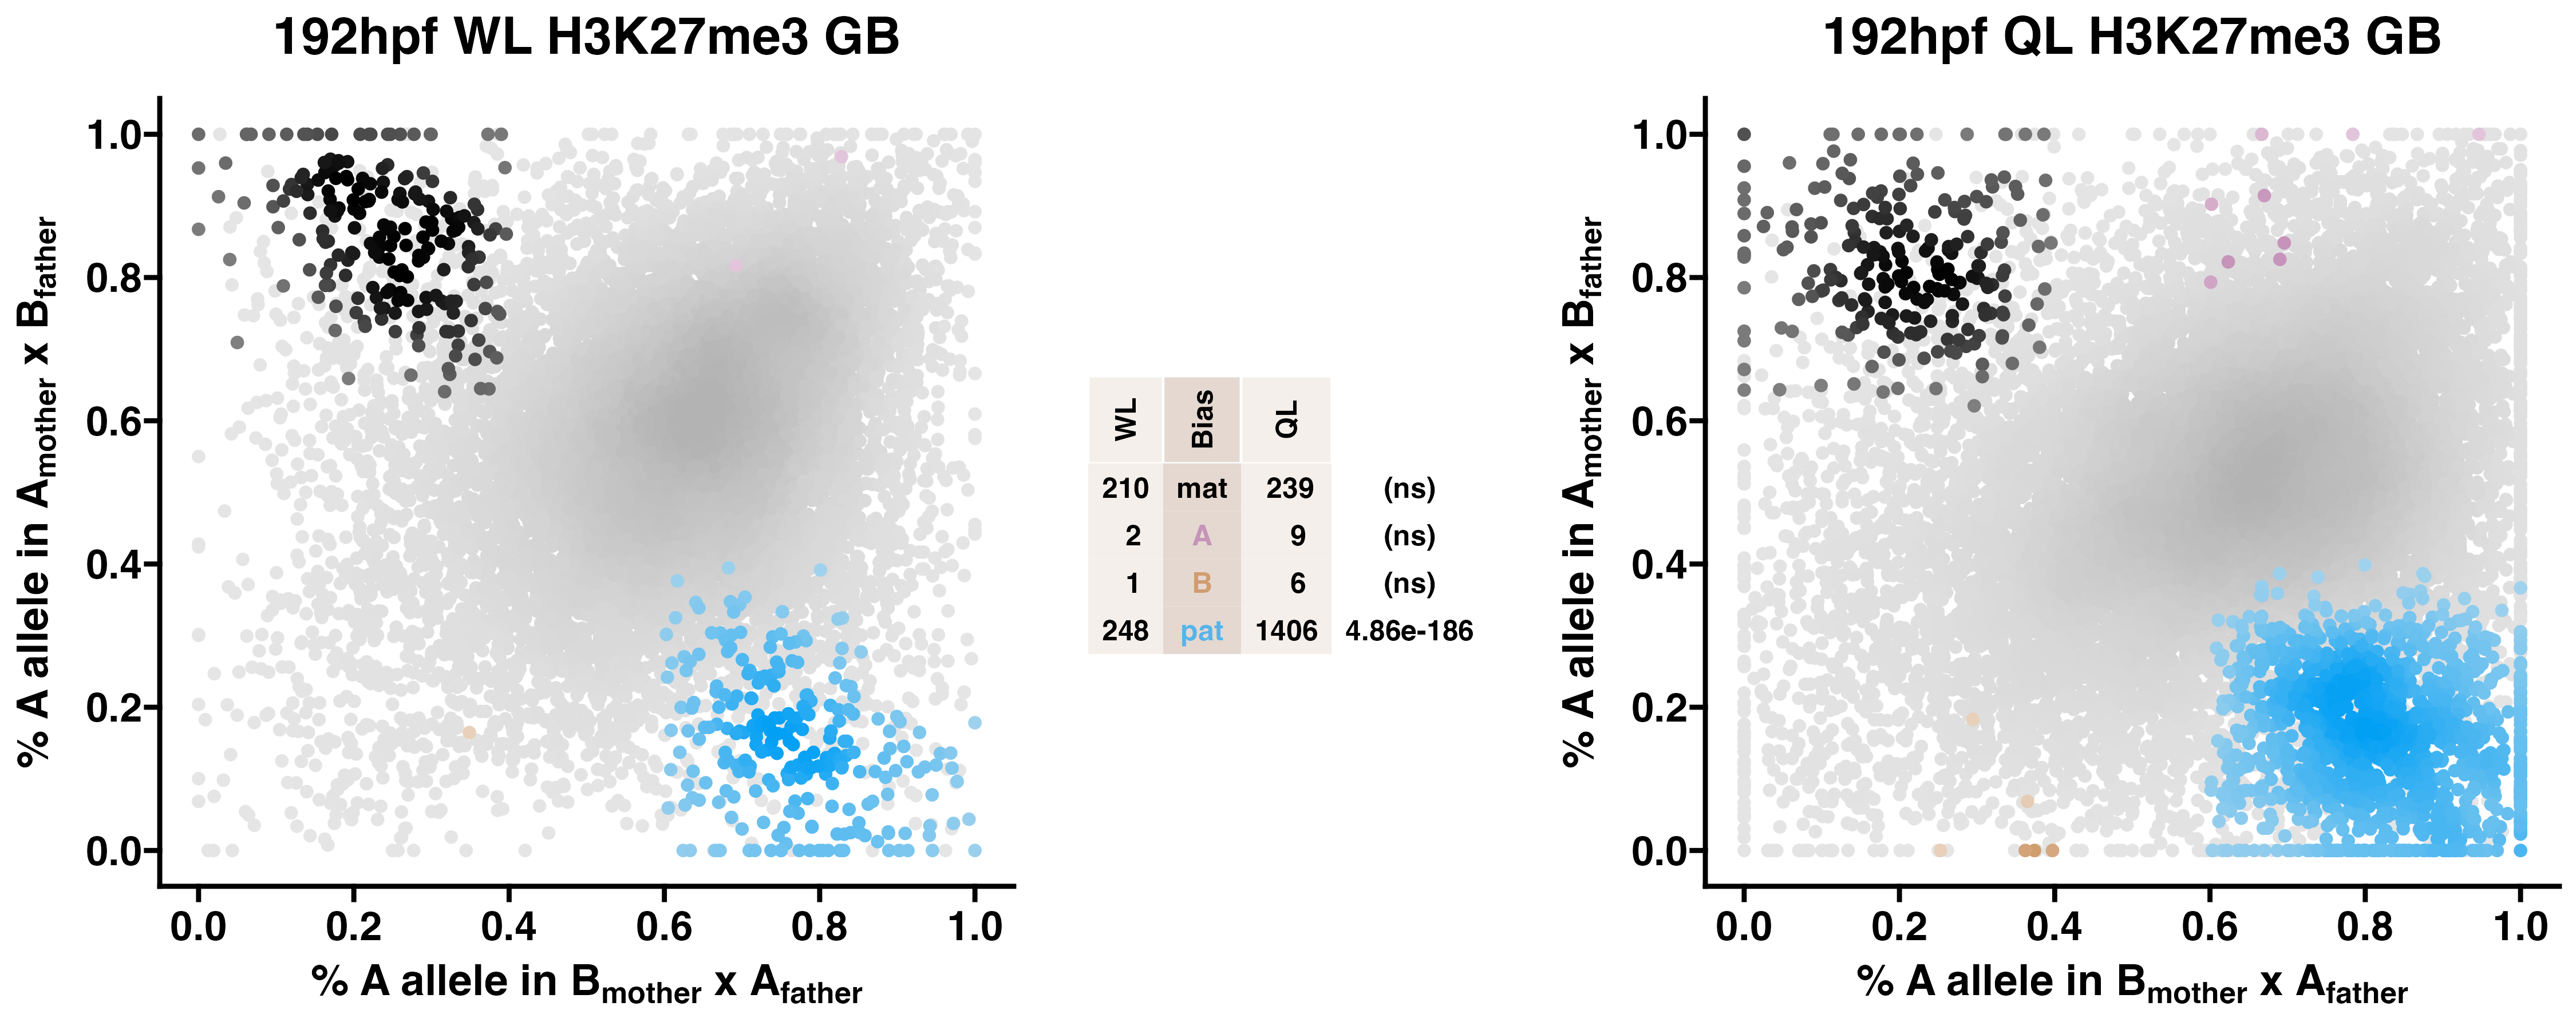
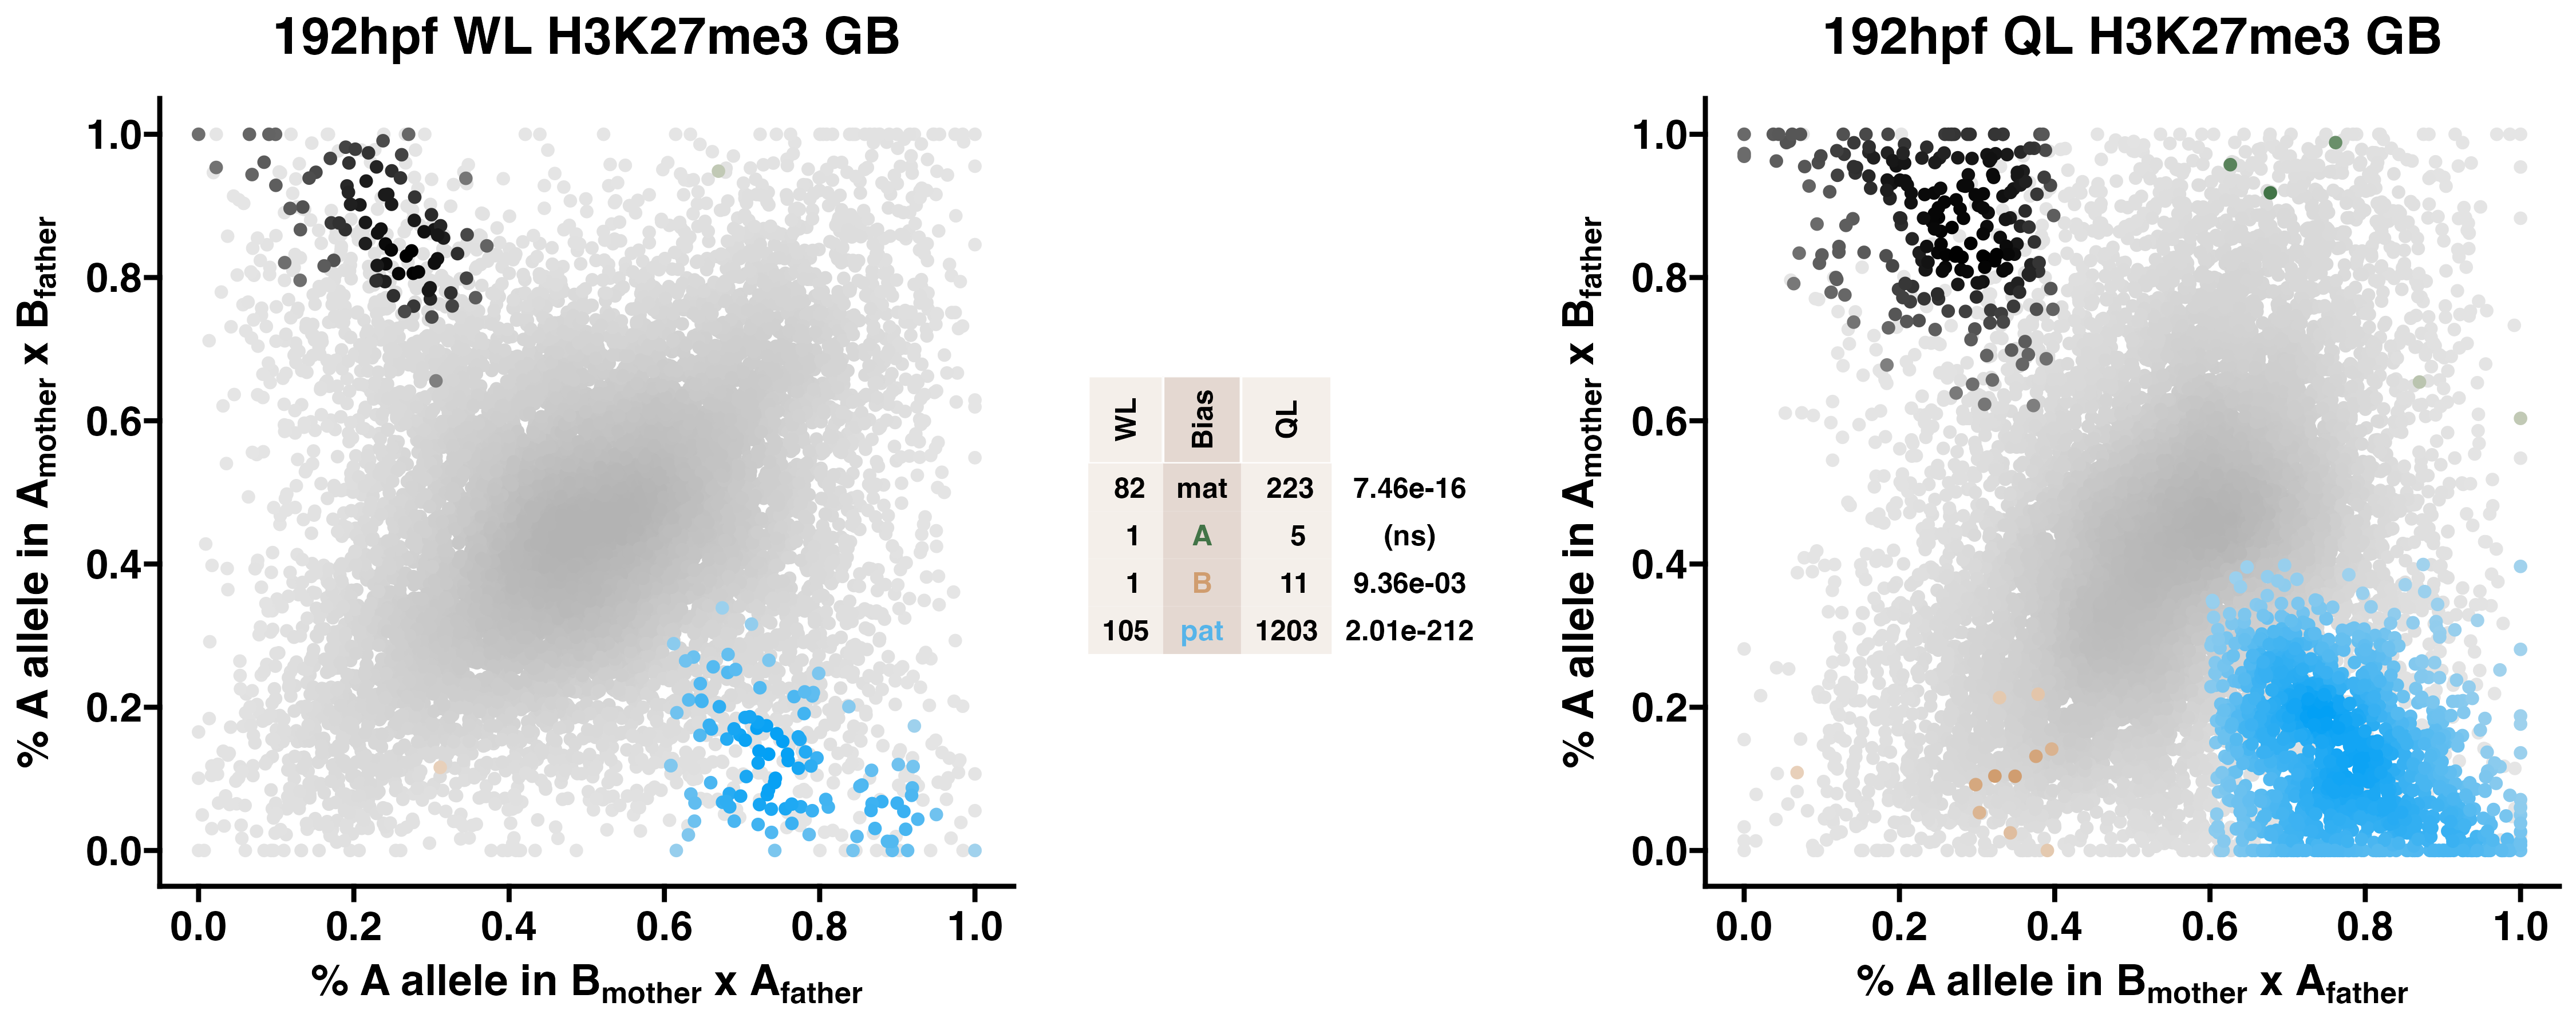
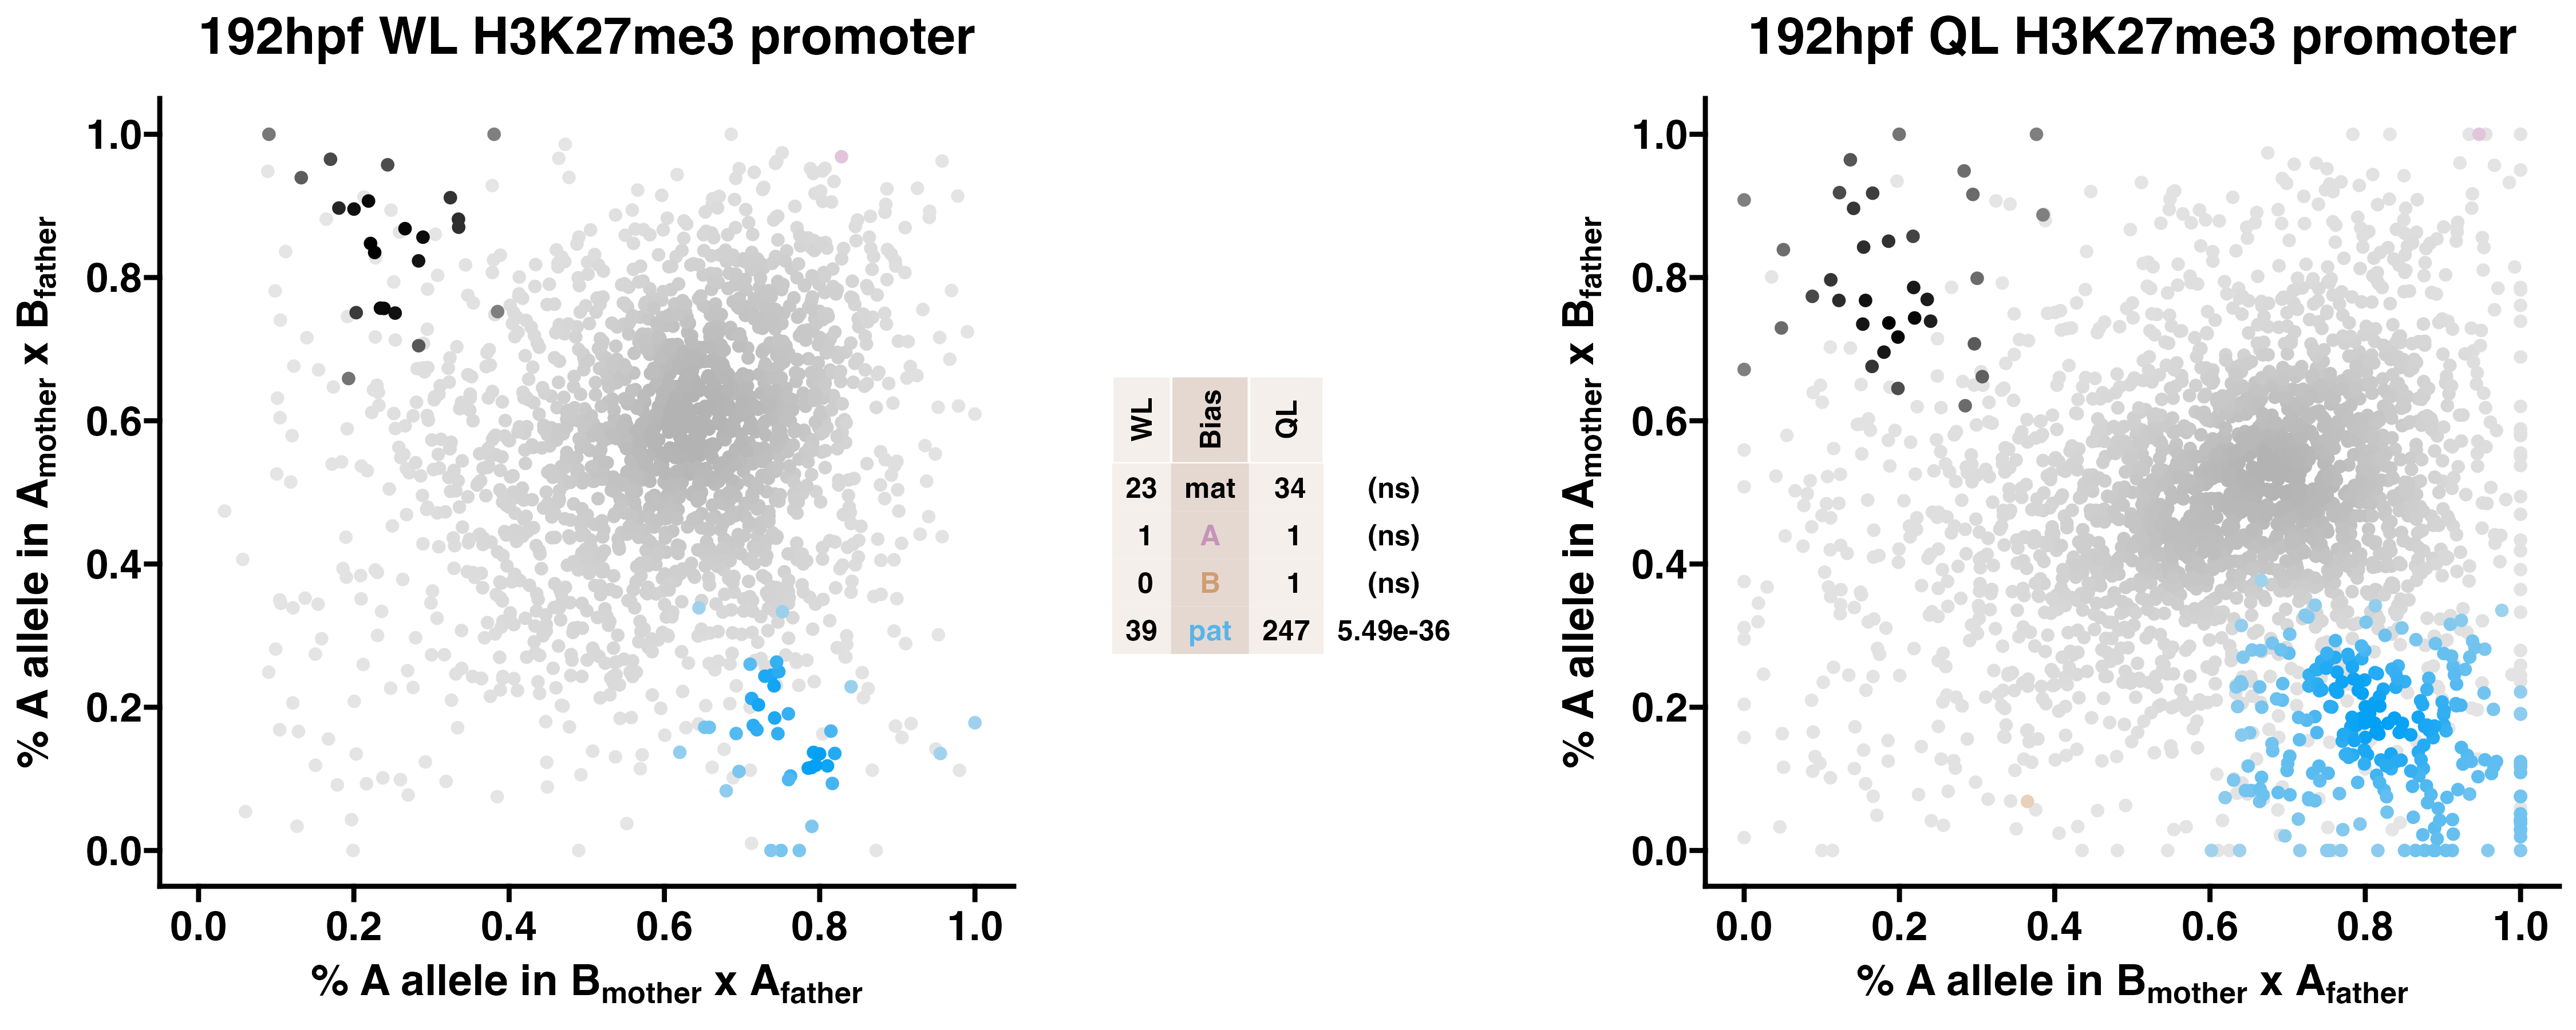
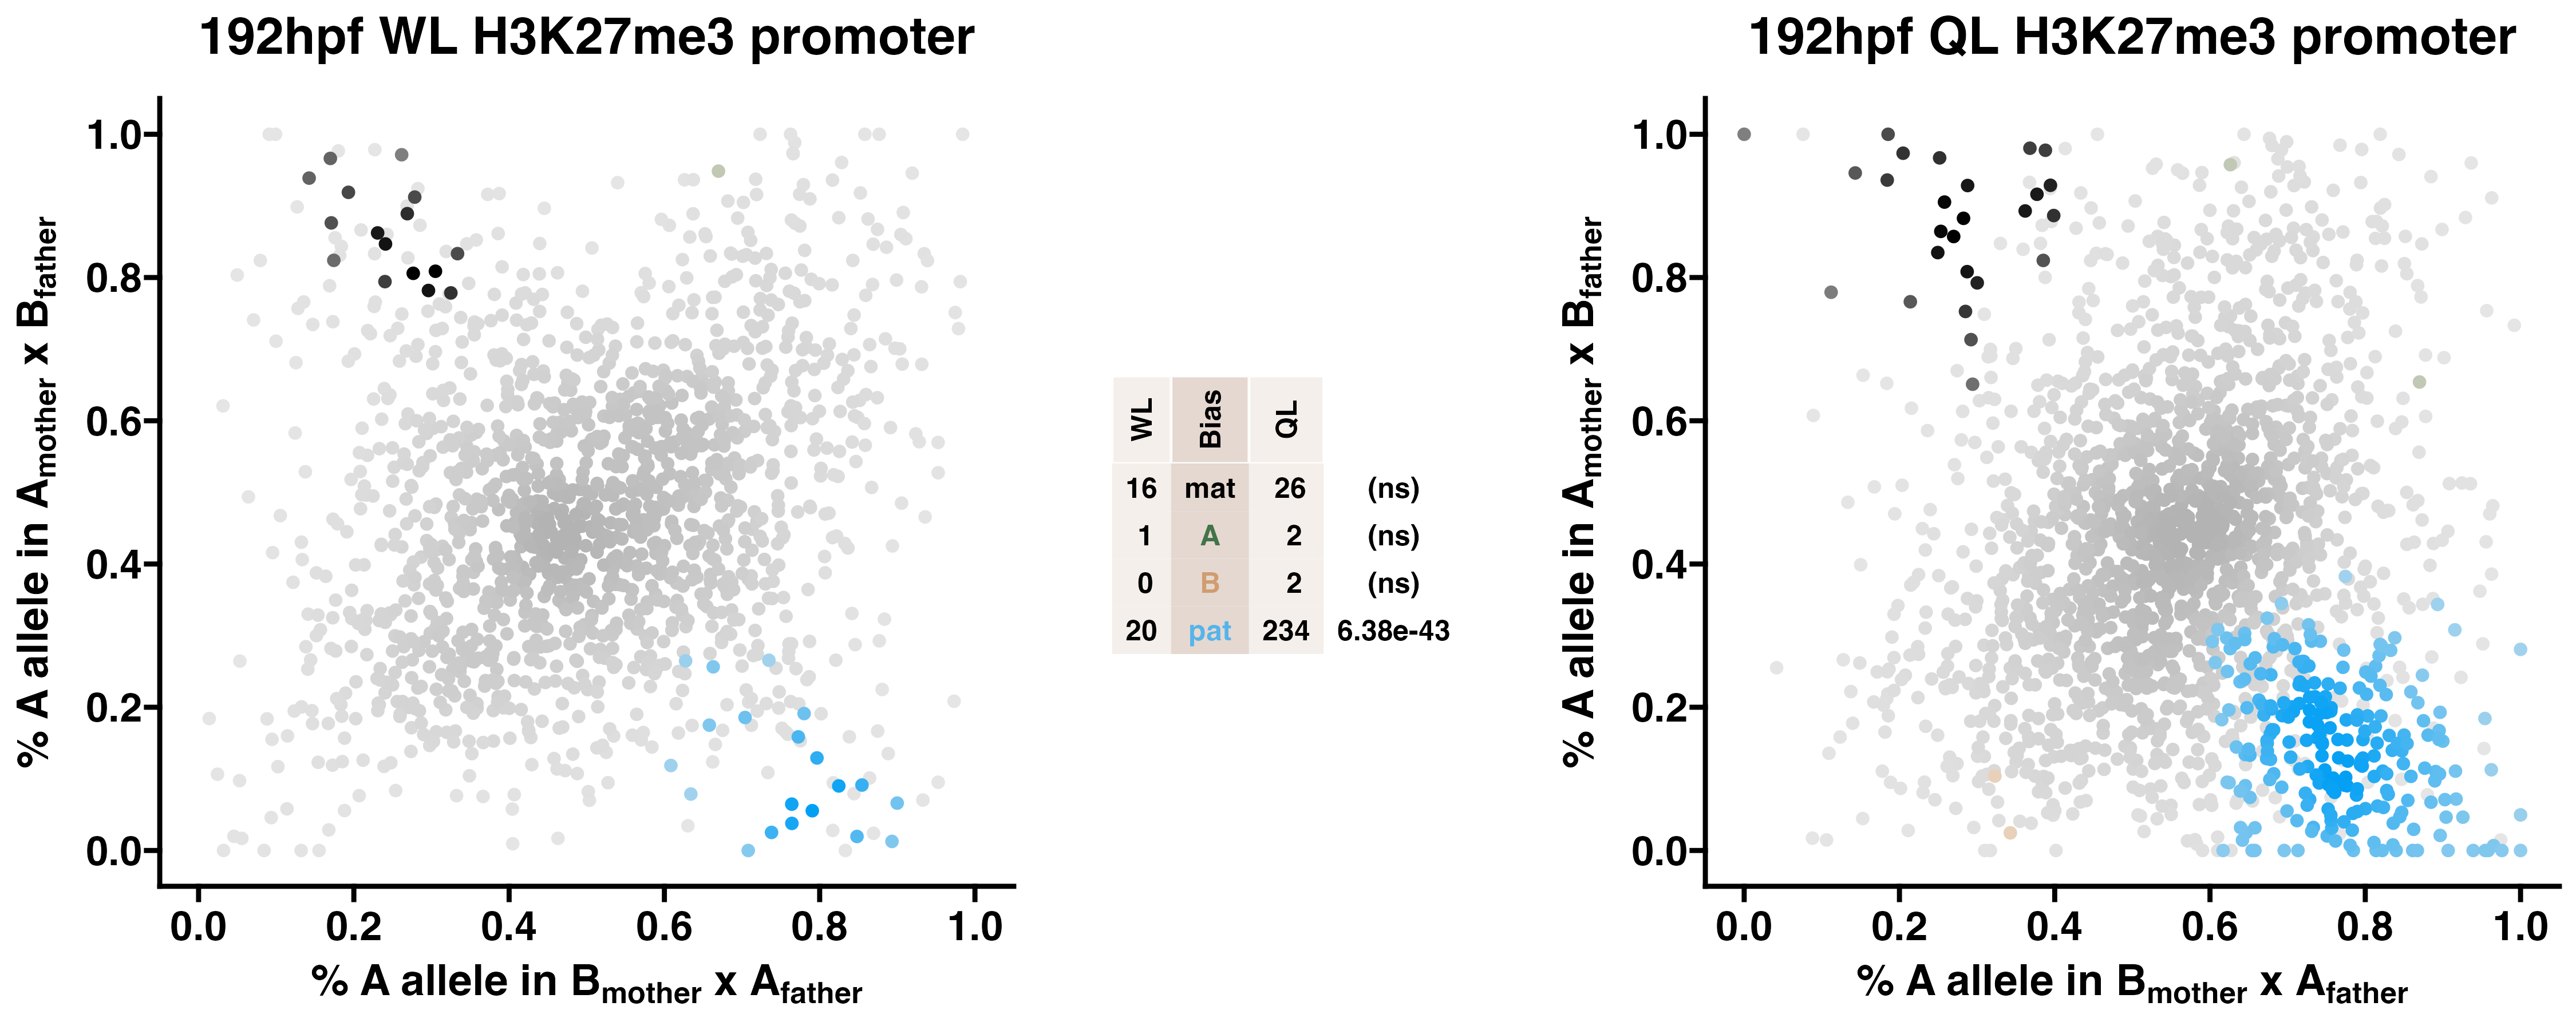
5.3 H3K27me3
Caste differentiation is associated with variation in POEs on H3K27me3 enrichment. Allele-specific enrichment at H3K27me3 peaks were assessed in F2 worker-destined larvae (WL) and queen-destined larvae (QL) at 192hpf collected from a reciprocal cross between different stocks of European honey bees. The x-axis represents, for each peak, the proportion of lineage A reads in bees with a lineage B mother and lineage A father. The y-axis represents, for each peak, the proportion of lineage A reads in bees with a lineage A mother and lineage B father (p2). Each color represents a peak which is significantly biased at all tested SNP positions. Significance was determined using the overlap between two statistical tests: a generalized linear interactive mixed model (GLIMMIX), and a Storer-Kim binomial exact test along with previously established thresholds of p1<0.4 and p2>0.6 for maternal bias, p1>0.6 and p2<0.4 for paternal bias, p1<0.4 and p2<0.4 for lineage B bias and p1>0.6 and p2>0.6 for lineage A bias.
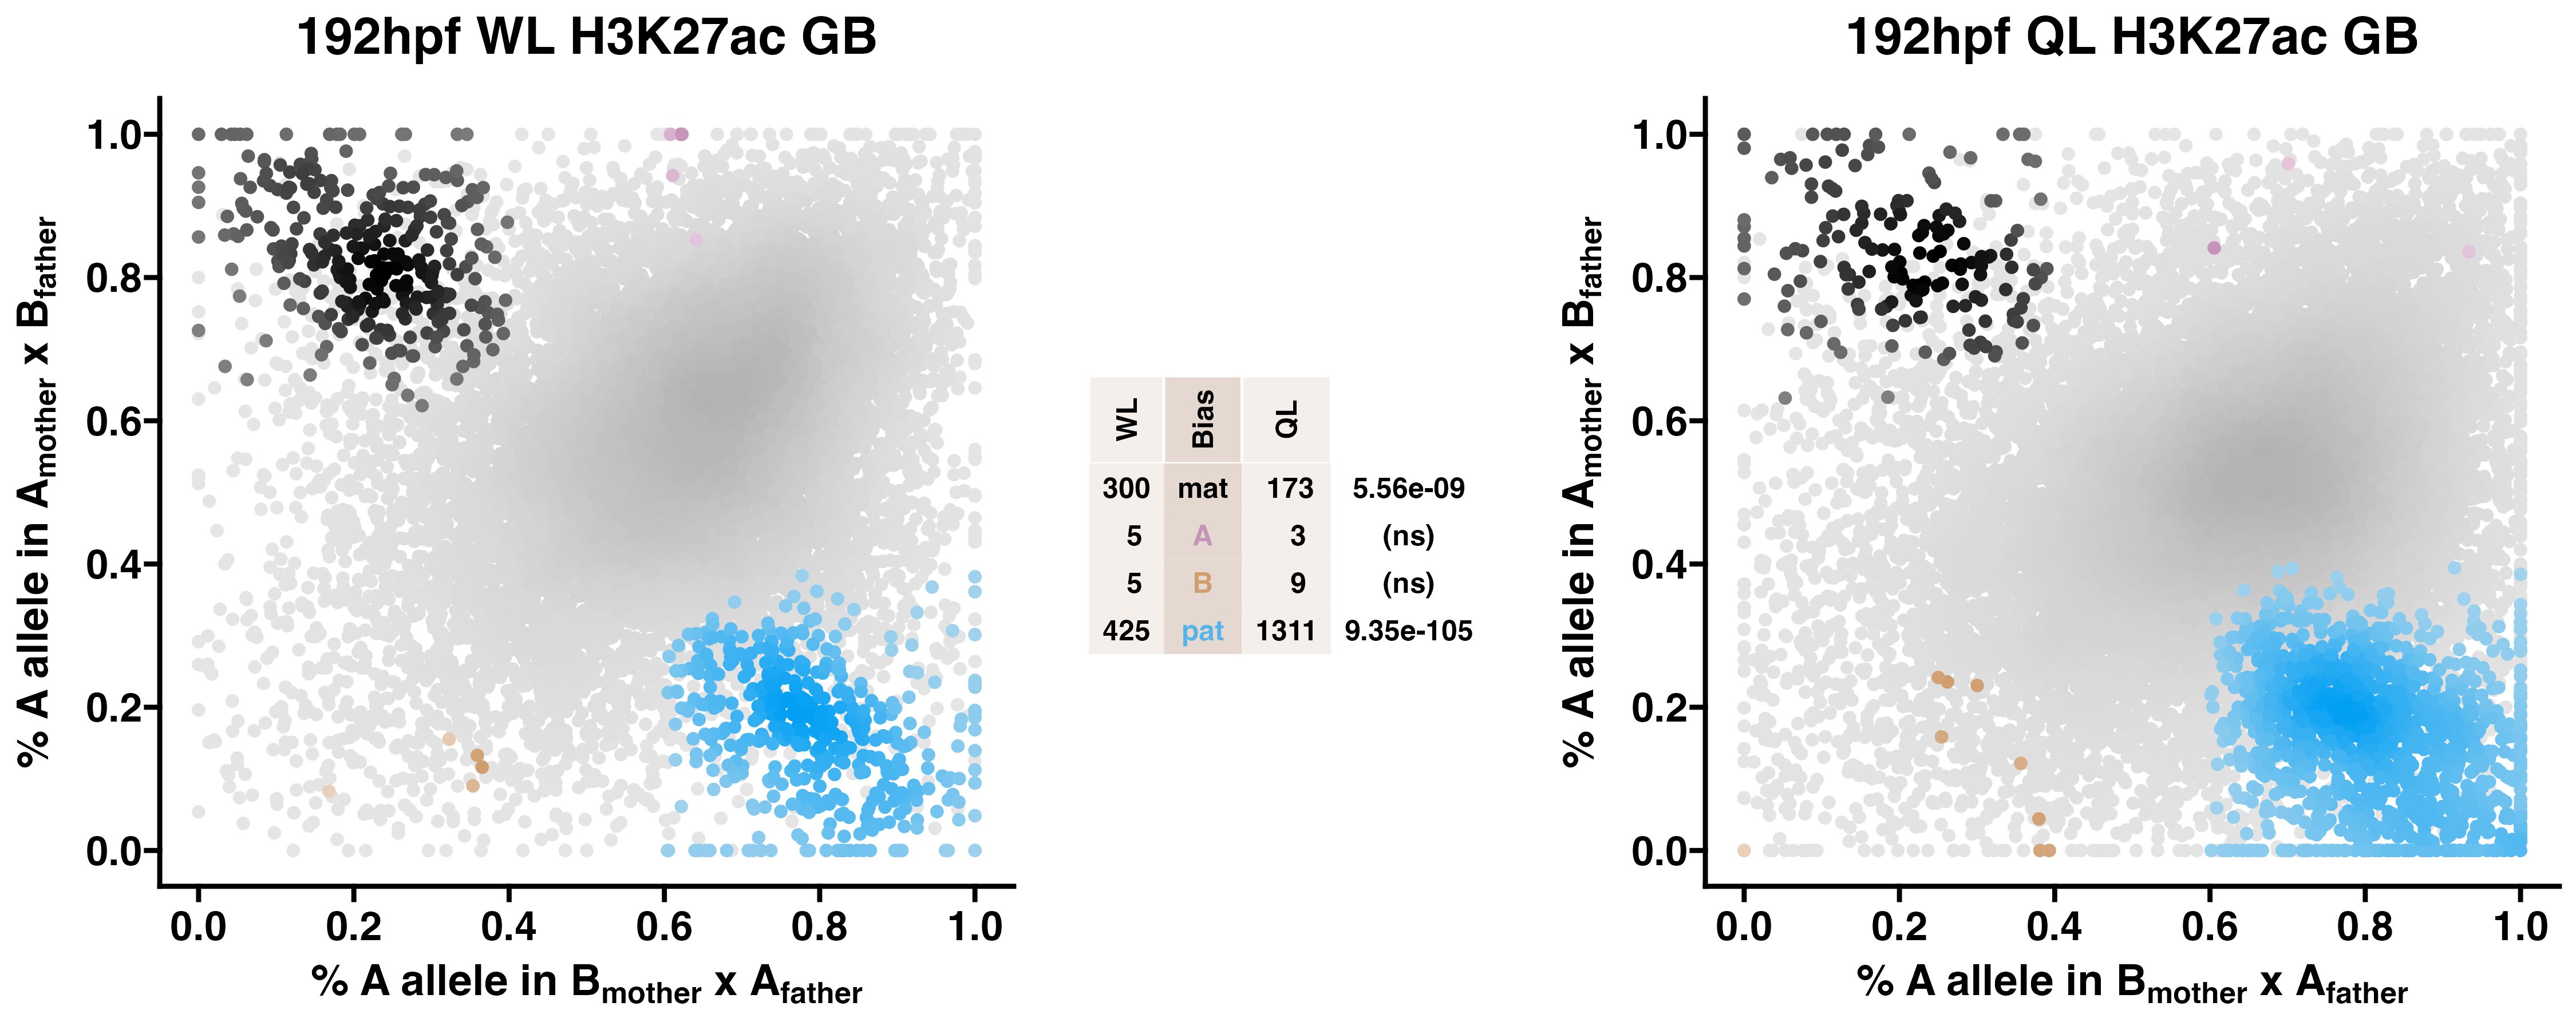
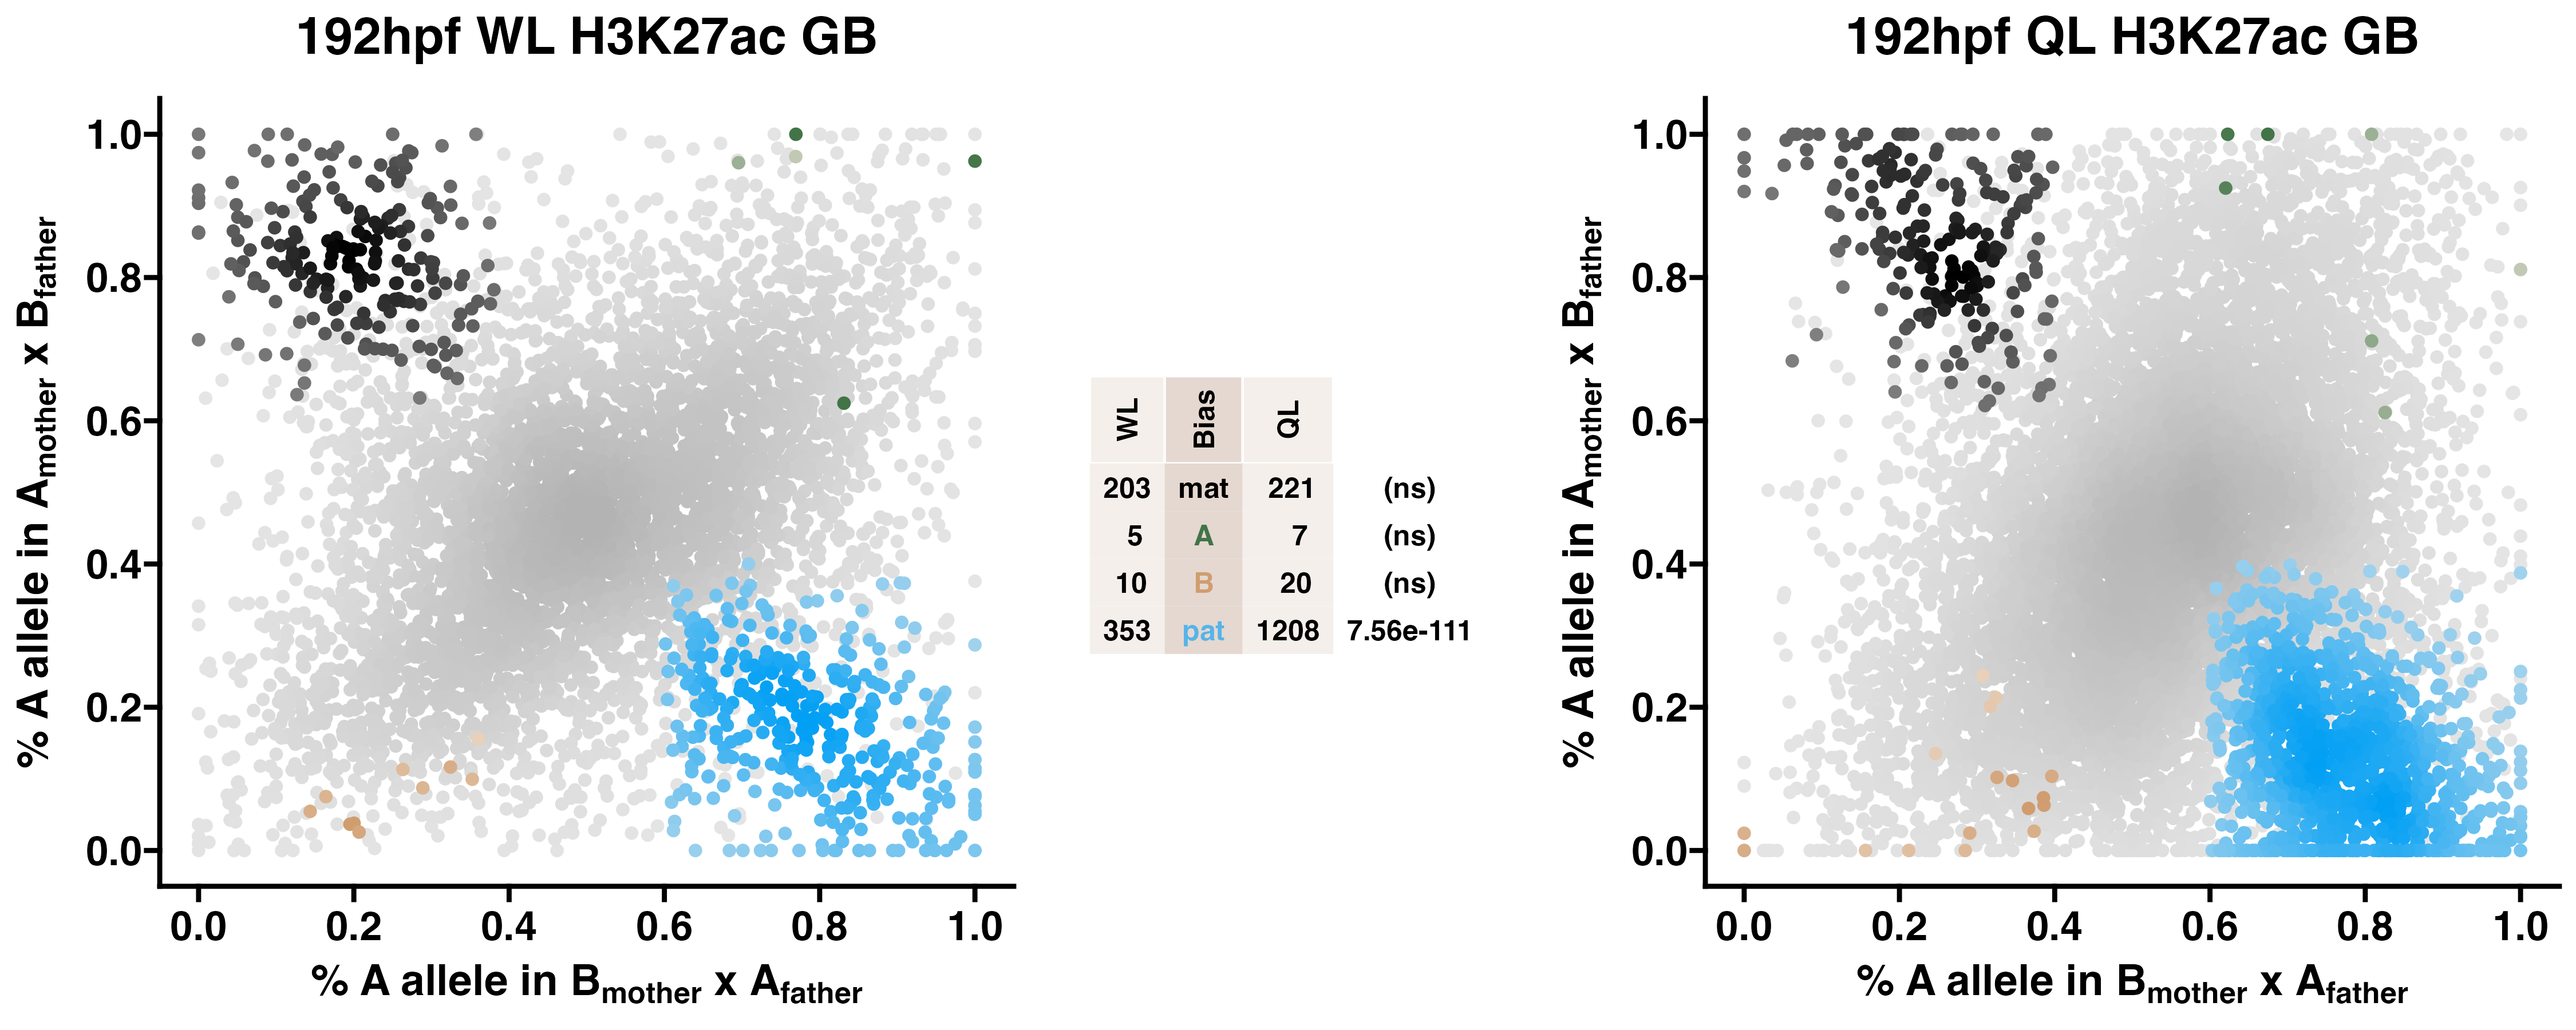
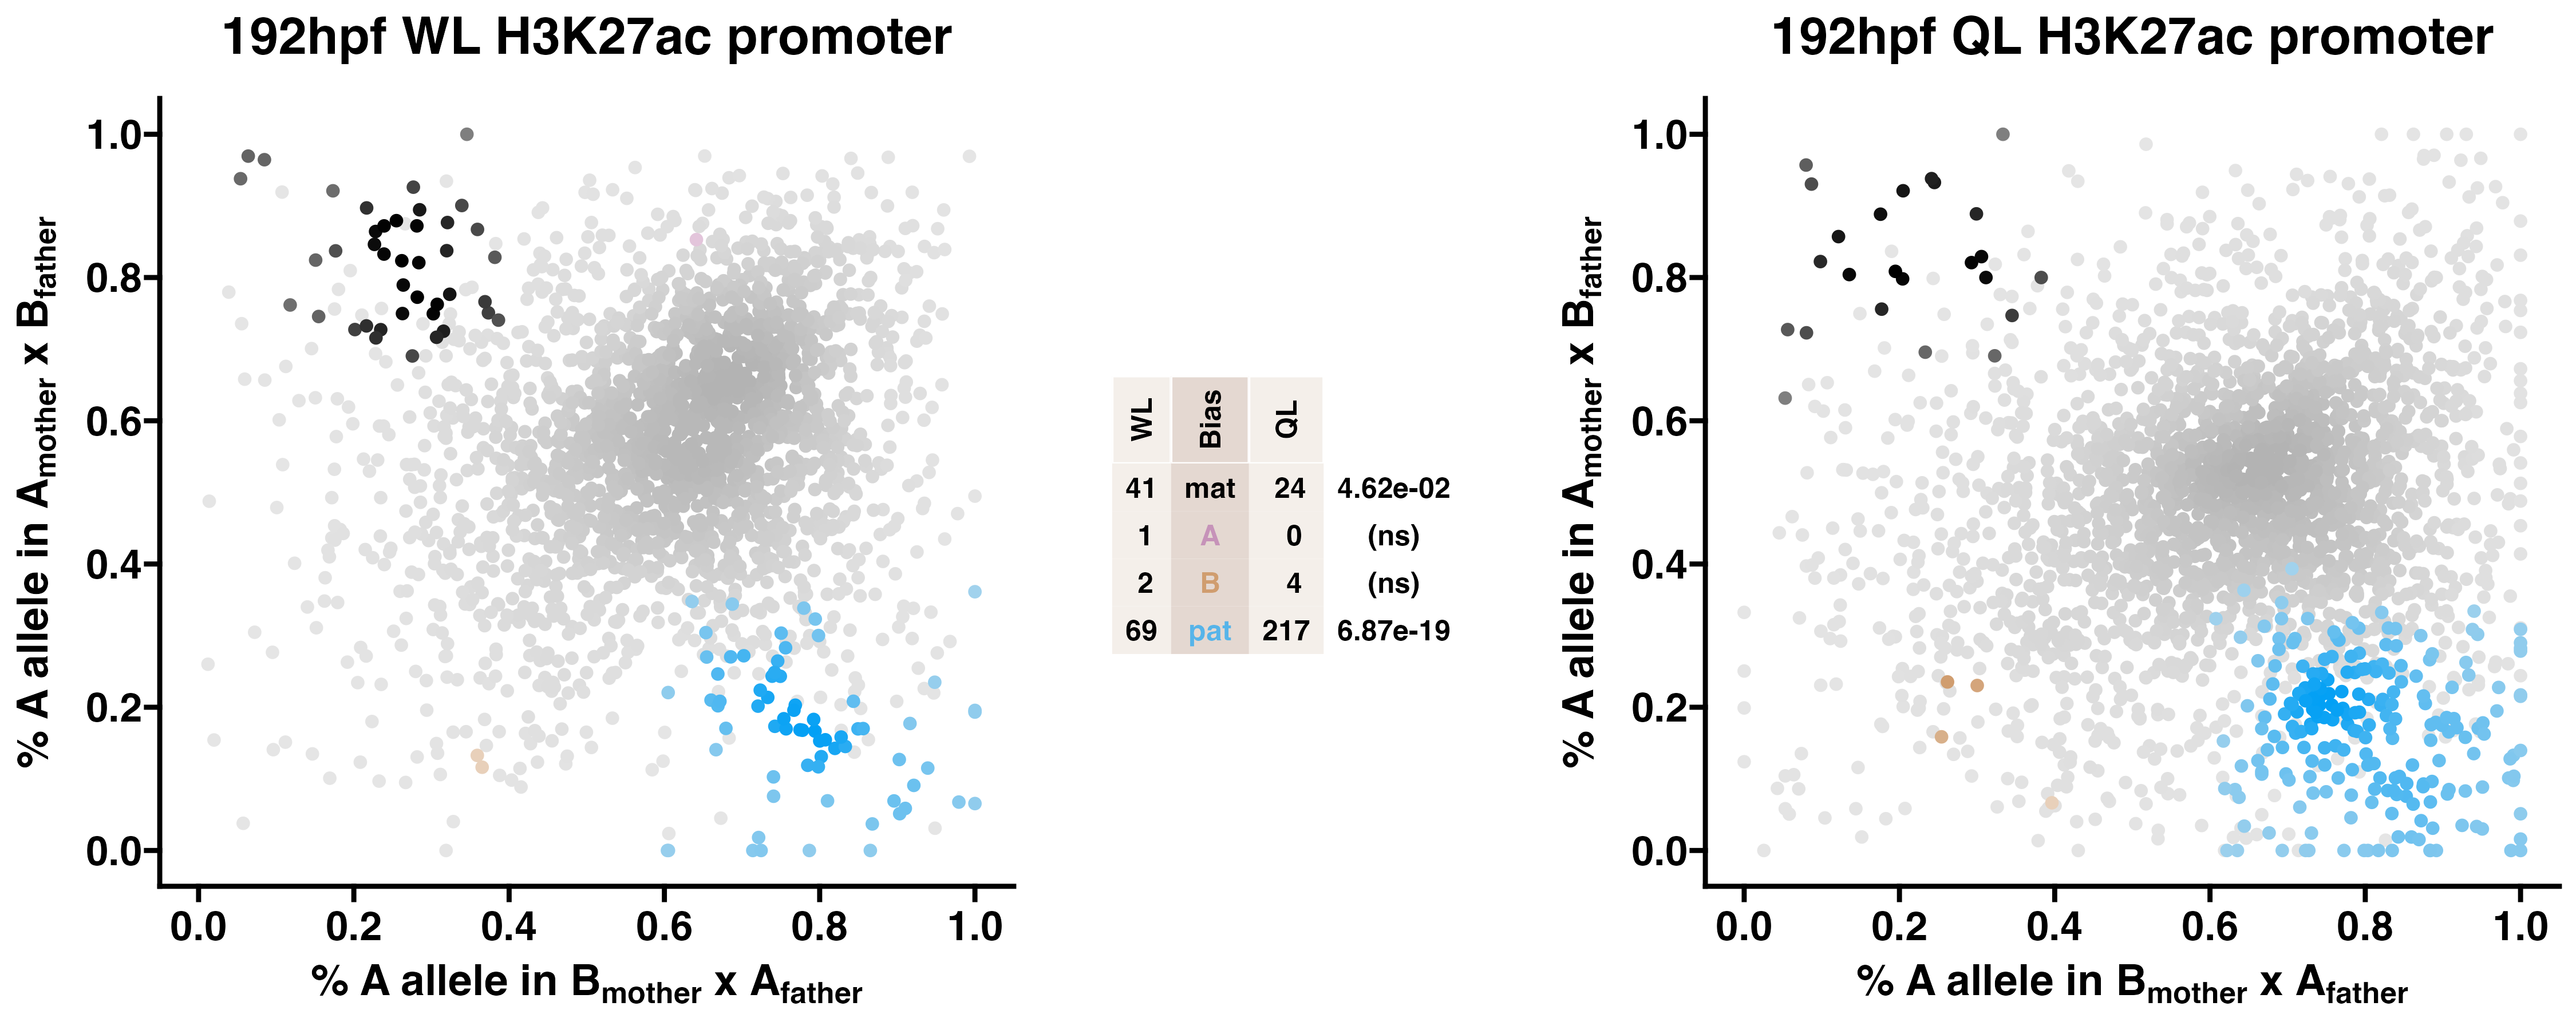
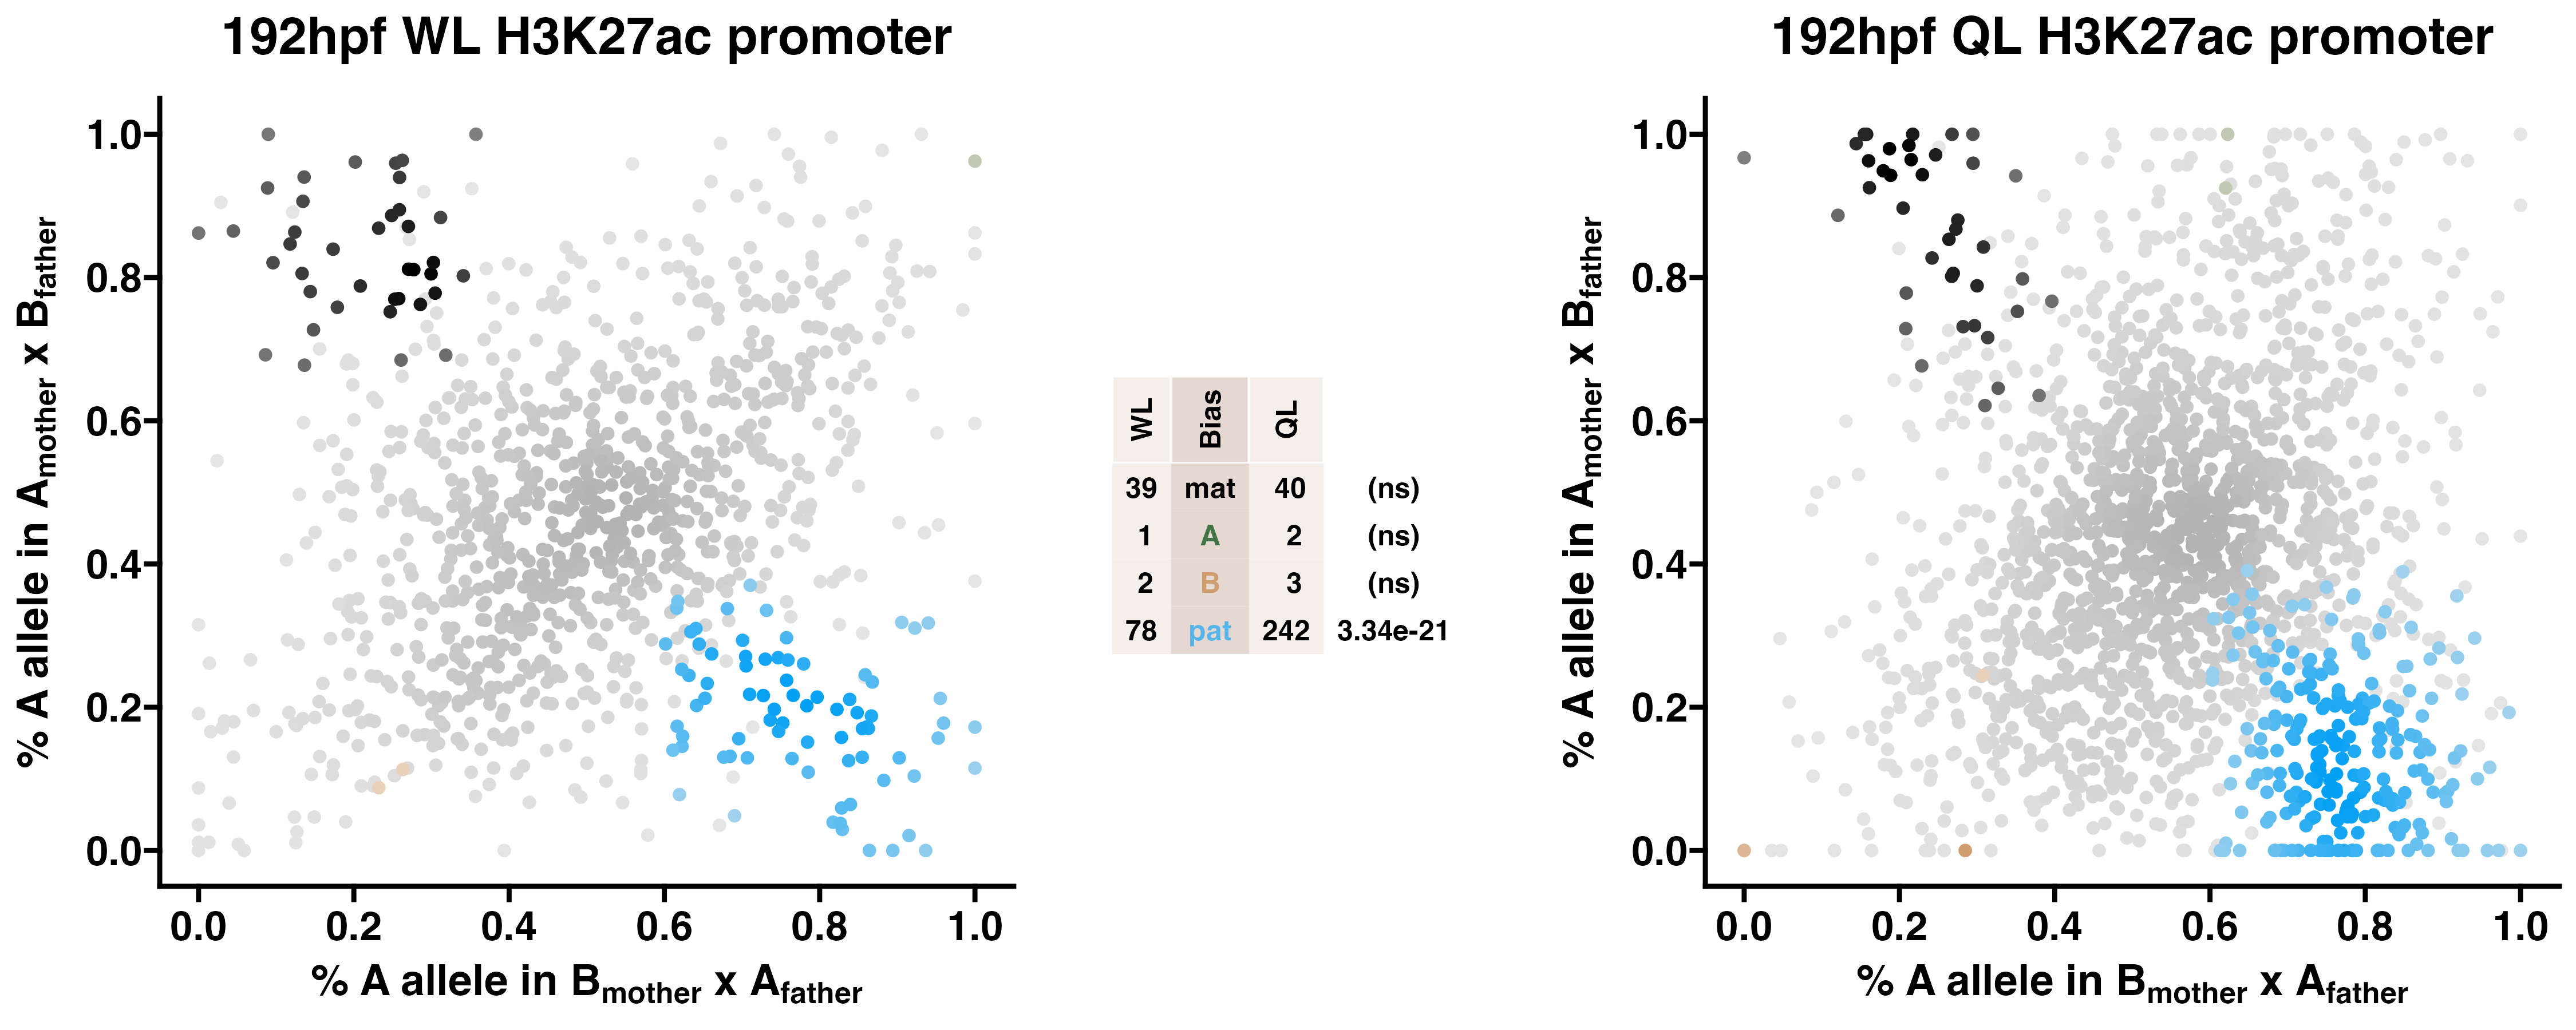
5.4 H3K27ac
Caste differentiation is associated with variation in POEs on H3K27ac enrichment. Allele-specific enrichment at H3K27ac peaks were assessed in F2 worker-destined larvae (WL) and queen-destined larvae (QL) at 192hpf collected from a reciprocal cross between different stocks of European honey bees. The x-axis represents, for each peak, the proportion of lineage A reads in bees with a lineage B mother and lineage A father. The y-axis represents, for each peak, the proportion of lineage A reads in bees with a lineage A mother and lineage B father (p2). Each color represents a peak which is significantly biased at all tested SNP positions. Significance was determined using the overlap between two statistical tests: a generalized linear interactive mixed model (GLIMMIX), and a Storer-Kim binomial exact test along with previously established thresholds of p1<0.4 and p2>0.6 for maternal bias, p1>0.6 and p2<0.4 for paternal bias, p1<0.4 and p2<0.4 for lineage B bias and p1>0.6 and p2>0.6 for lineage A bias.
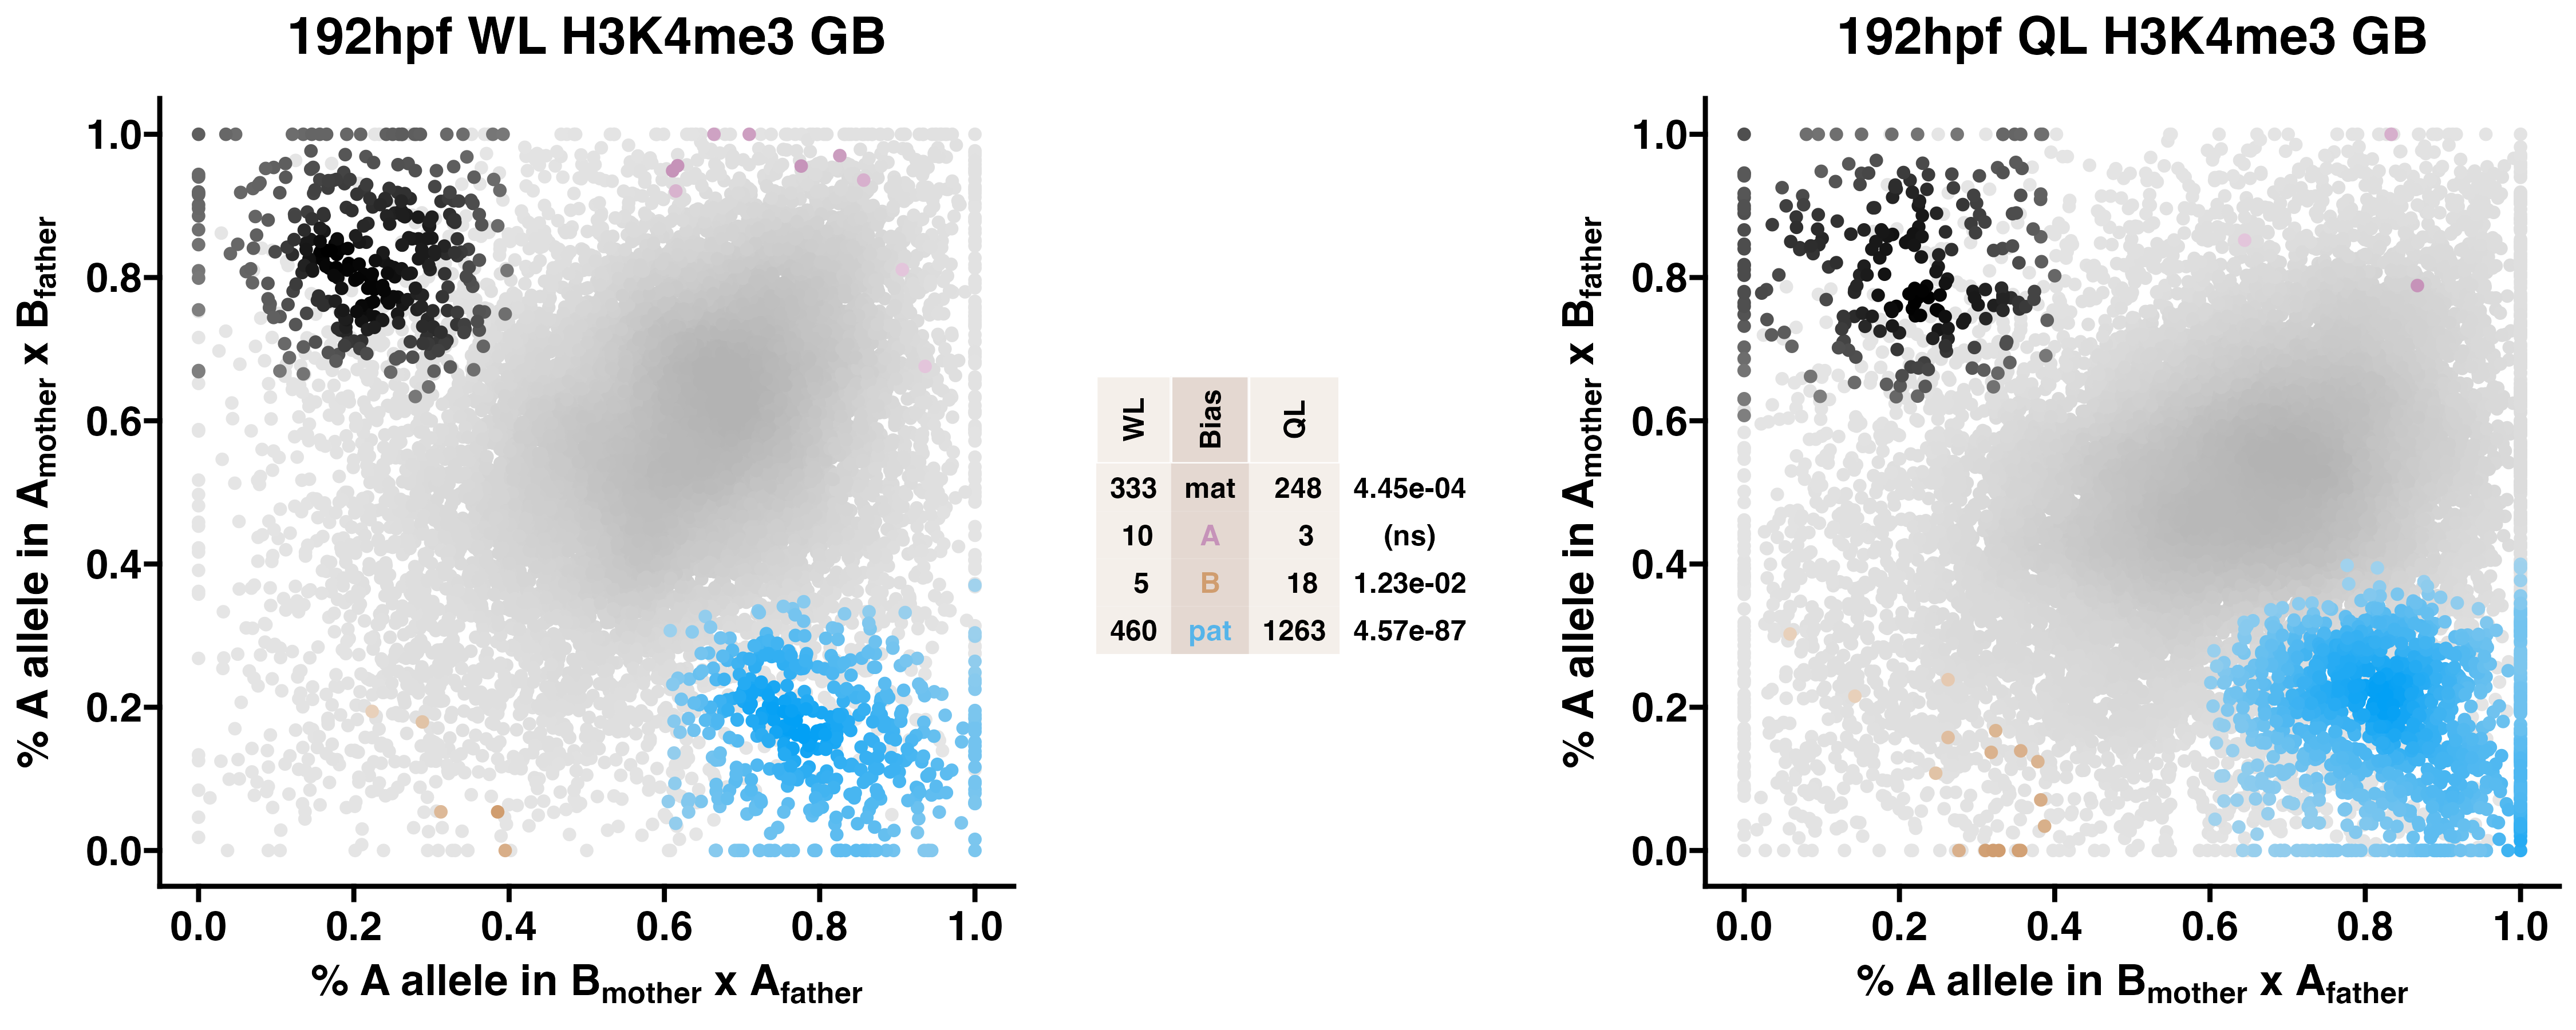
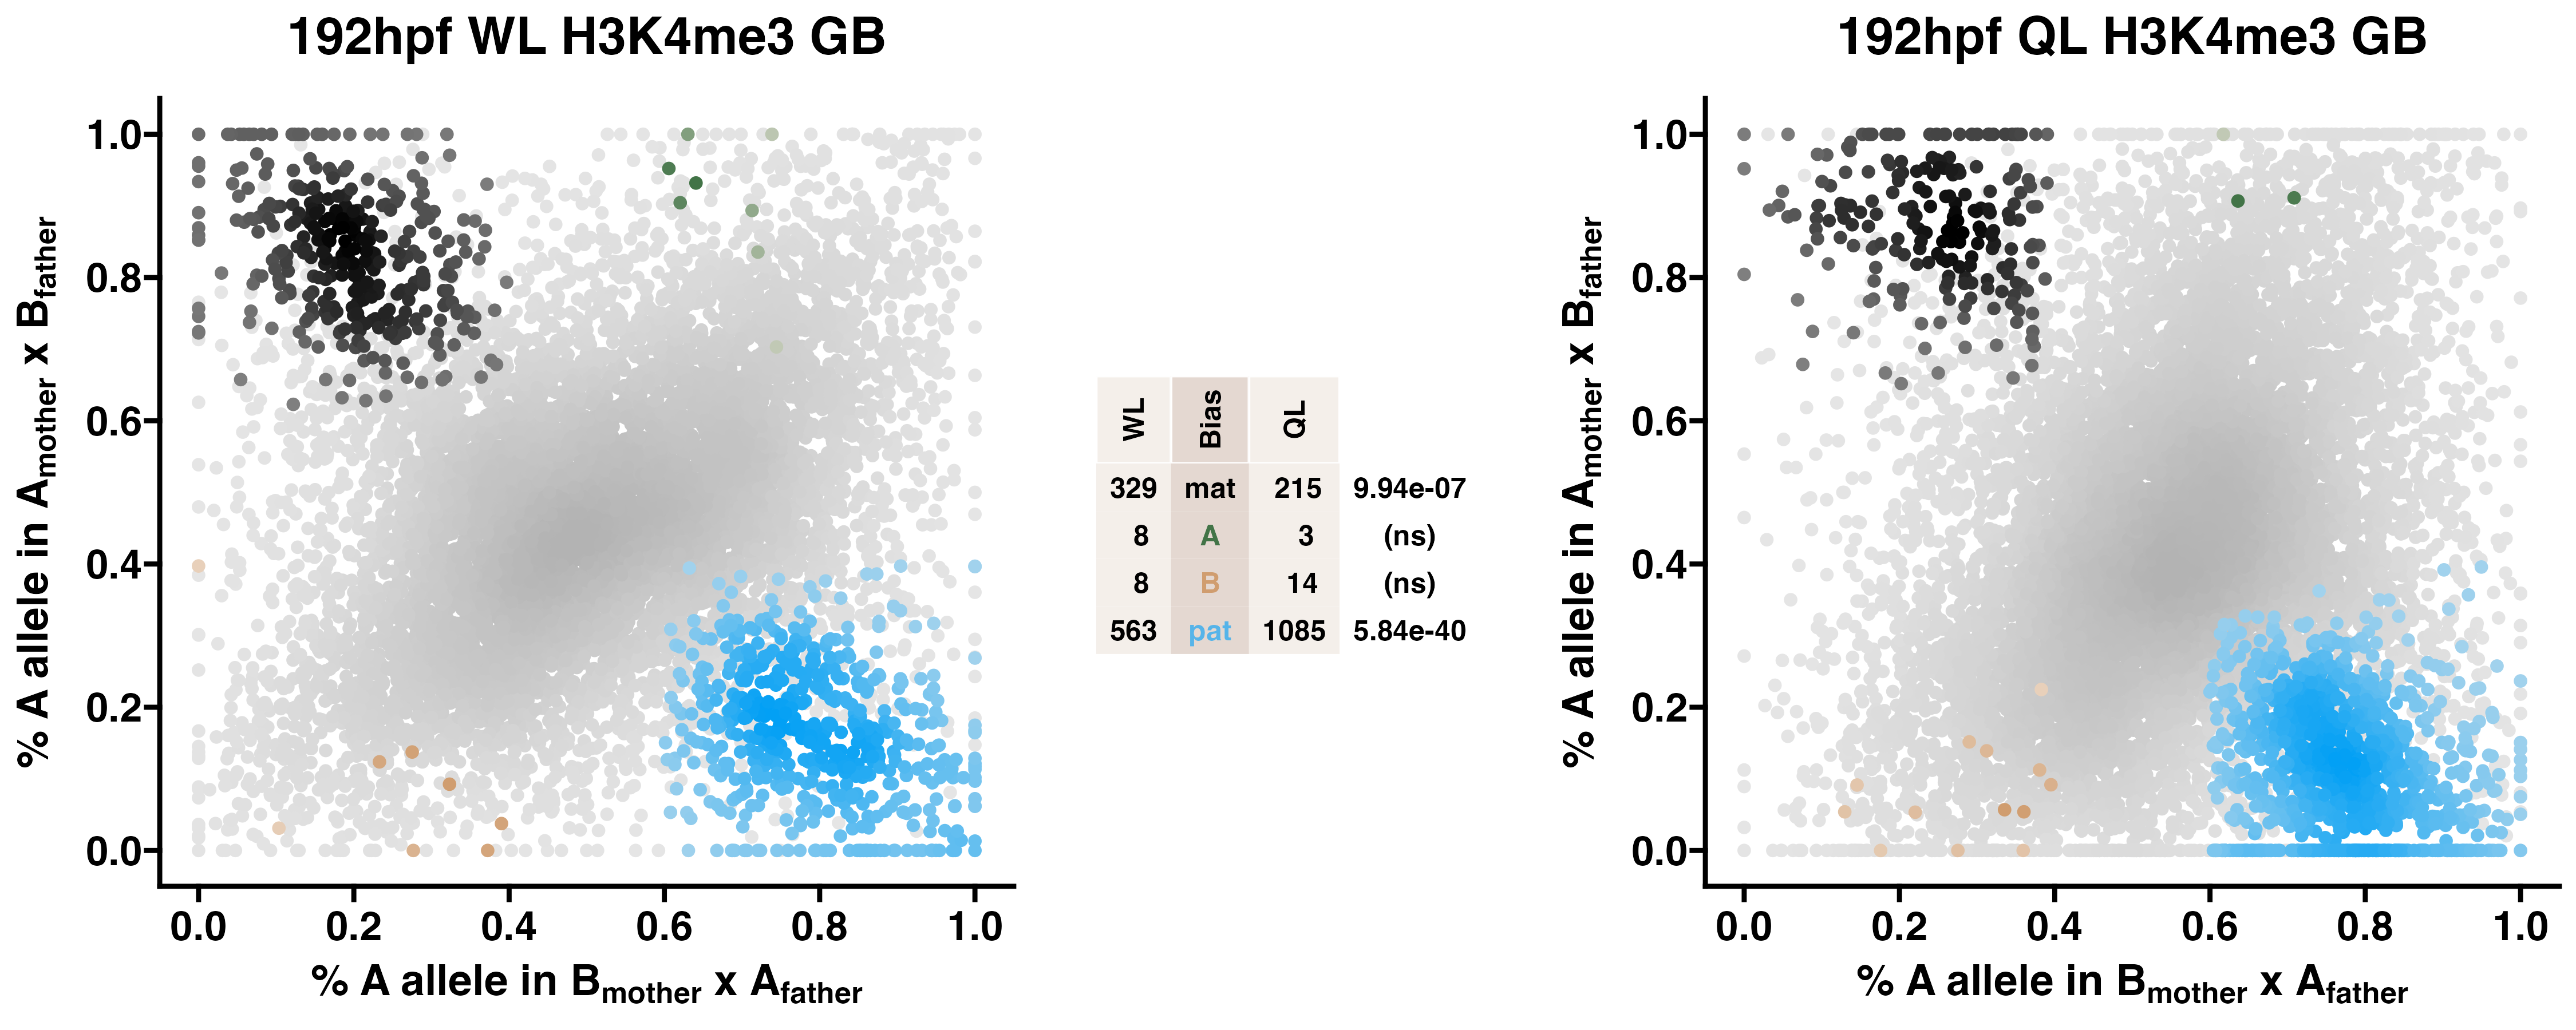
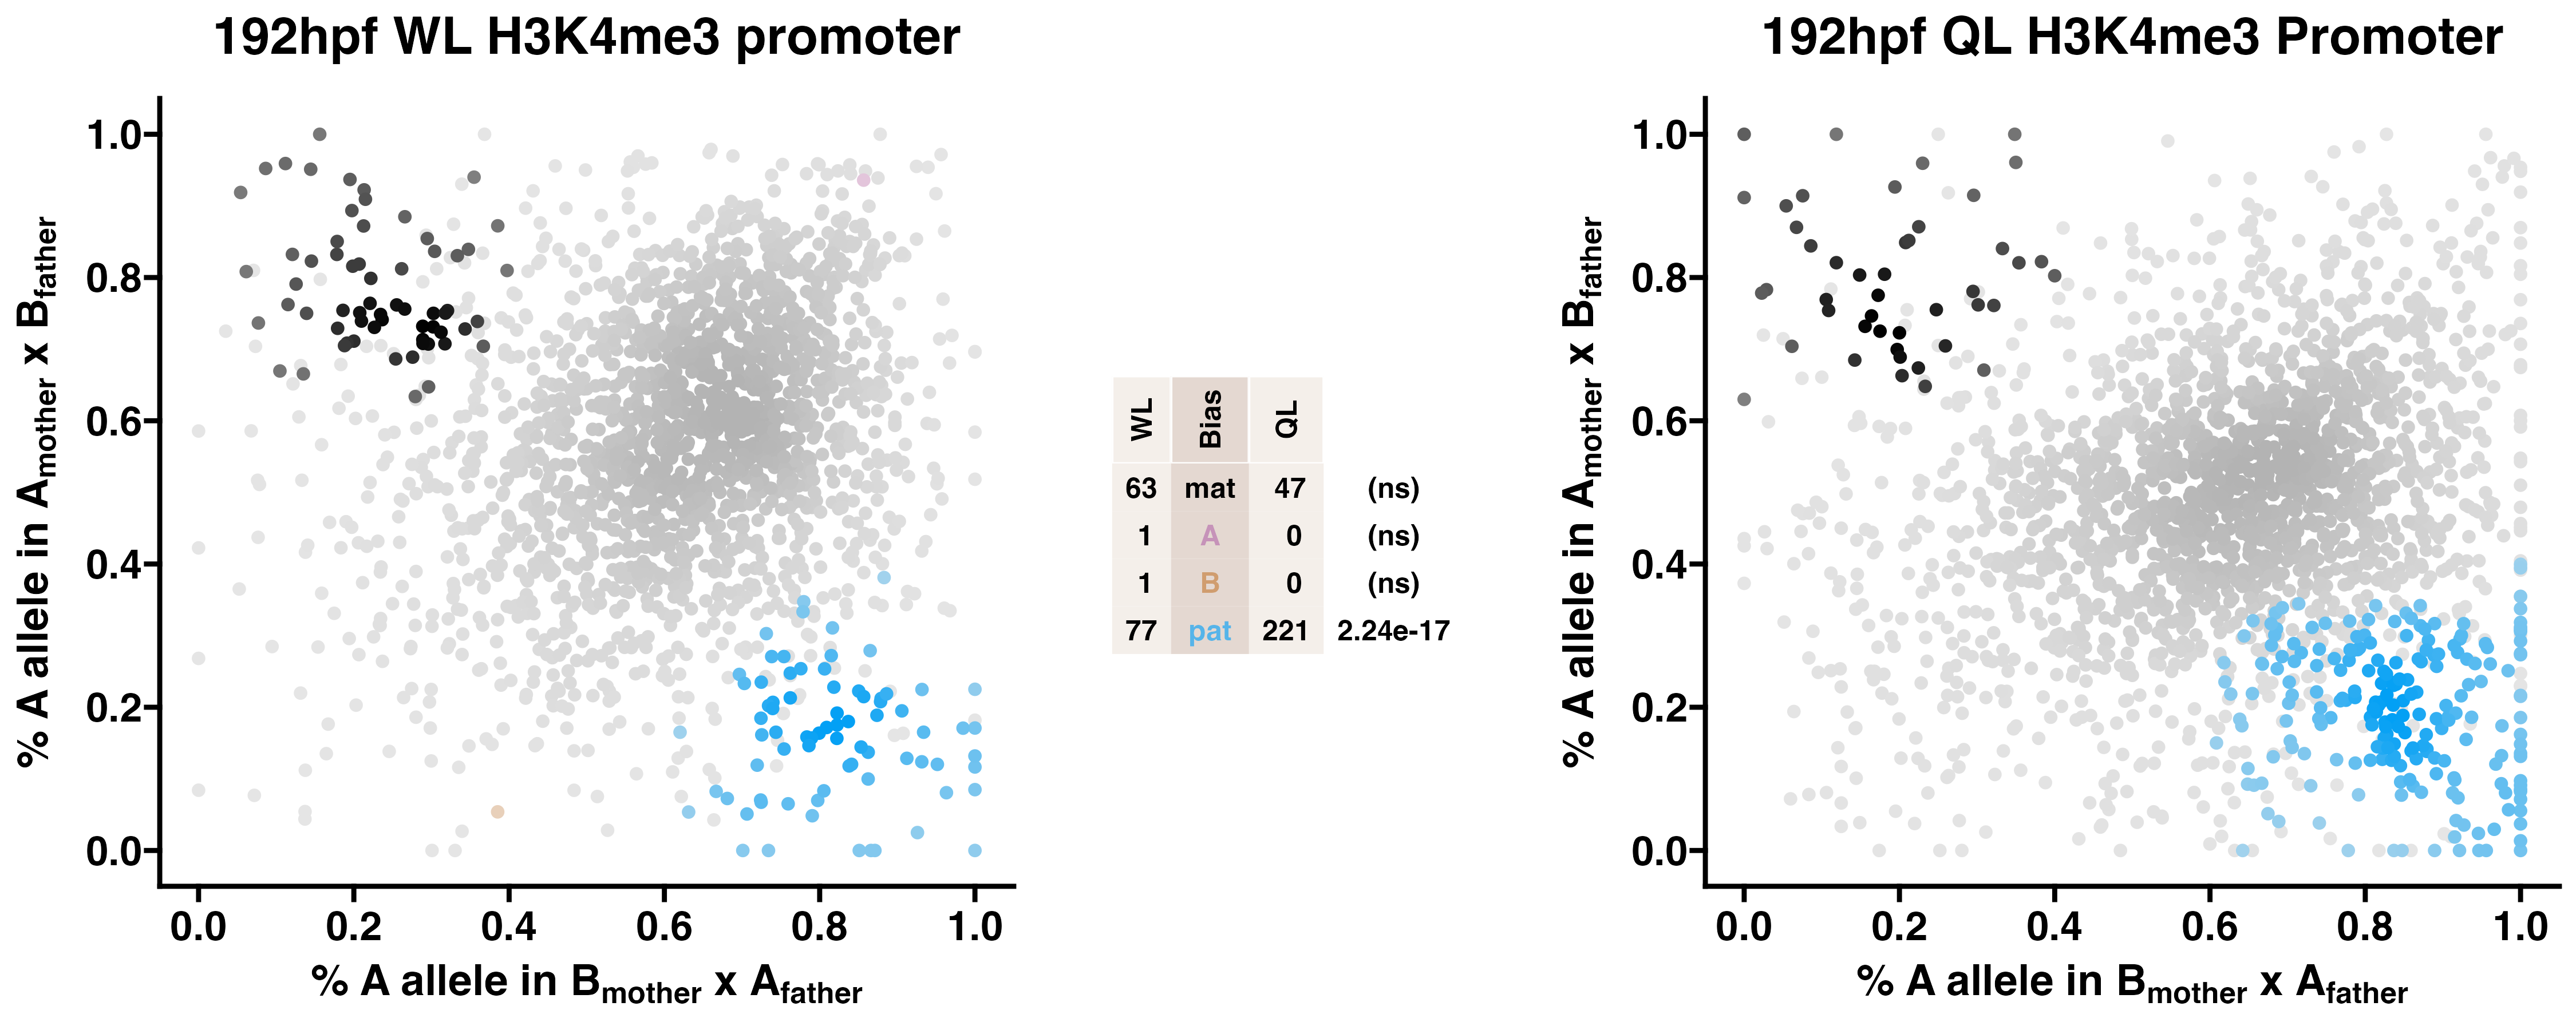
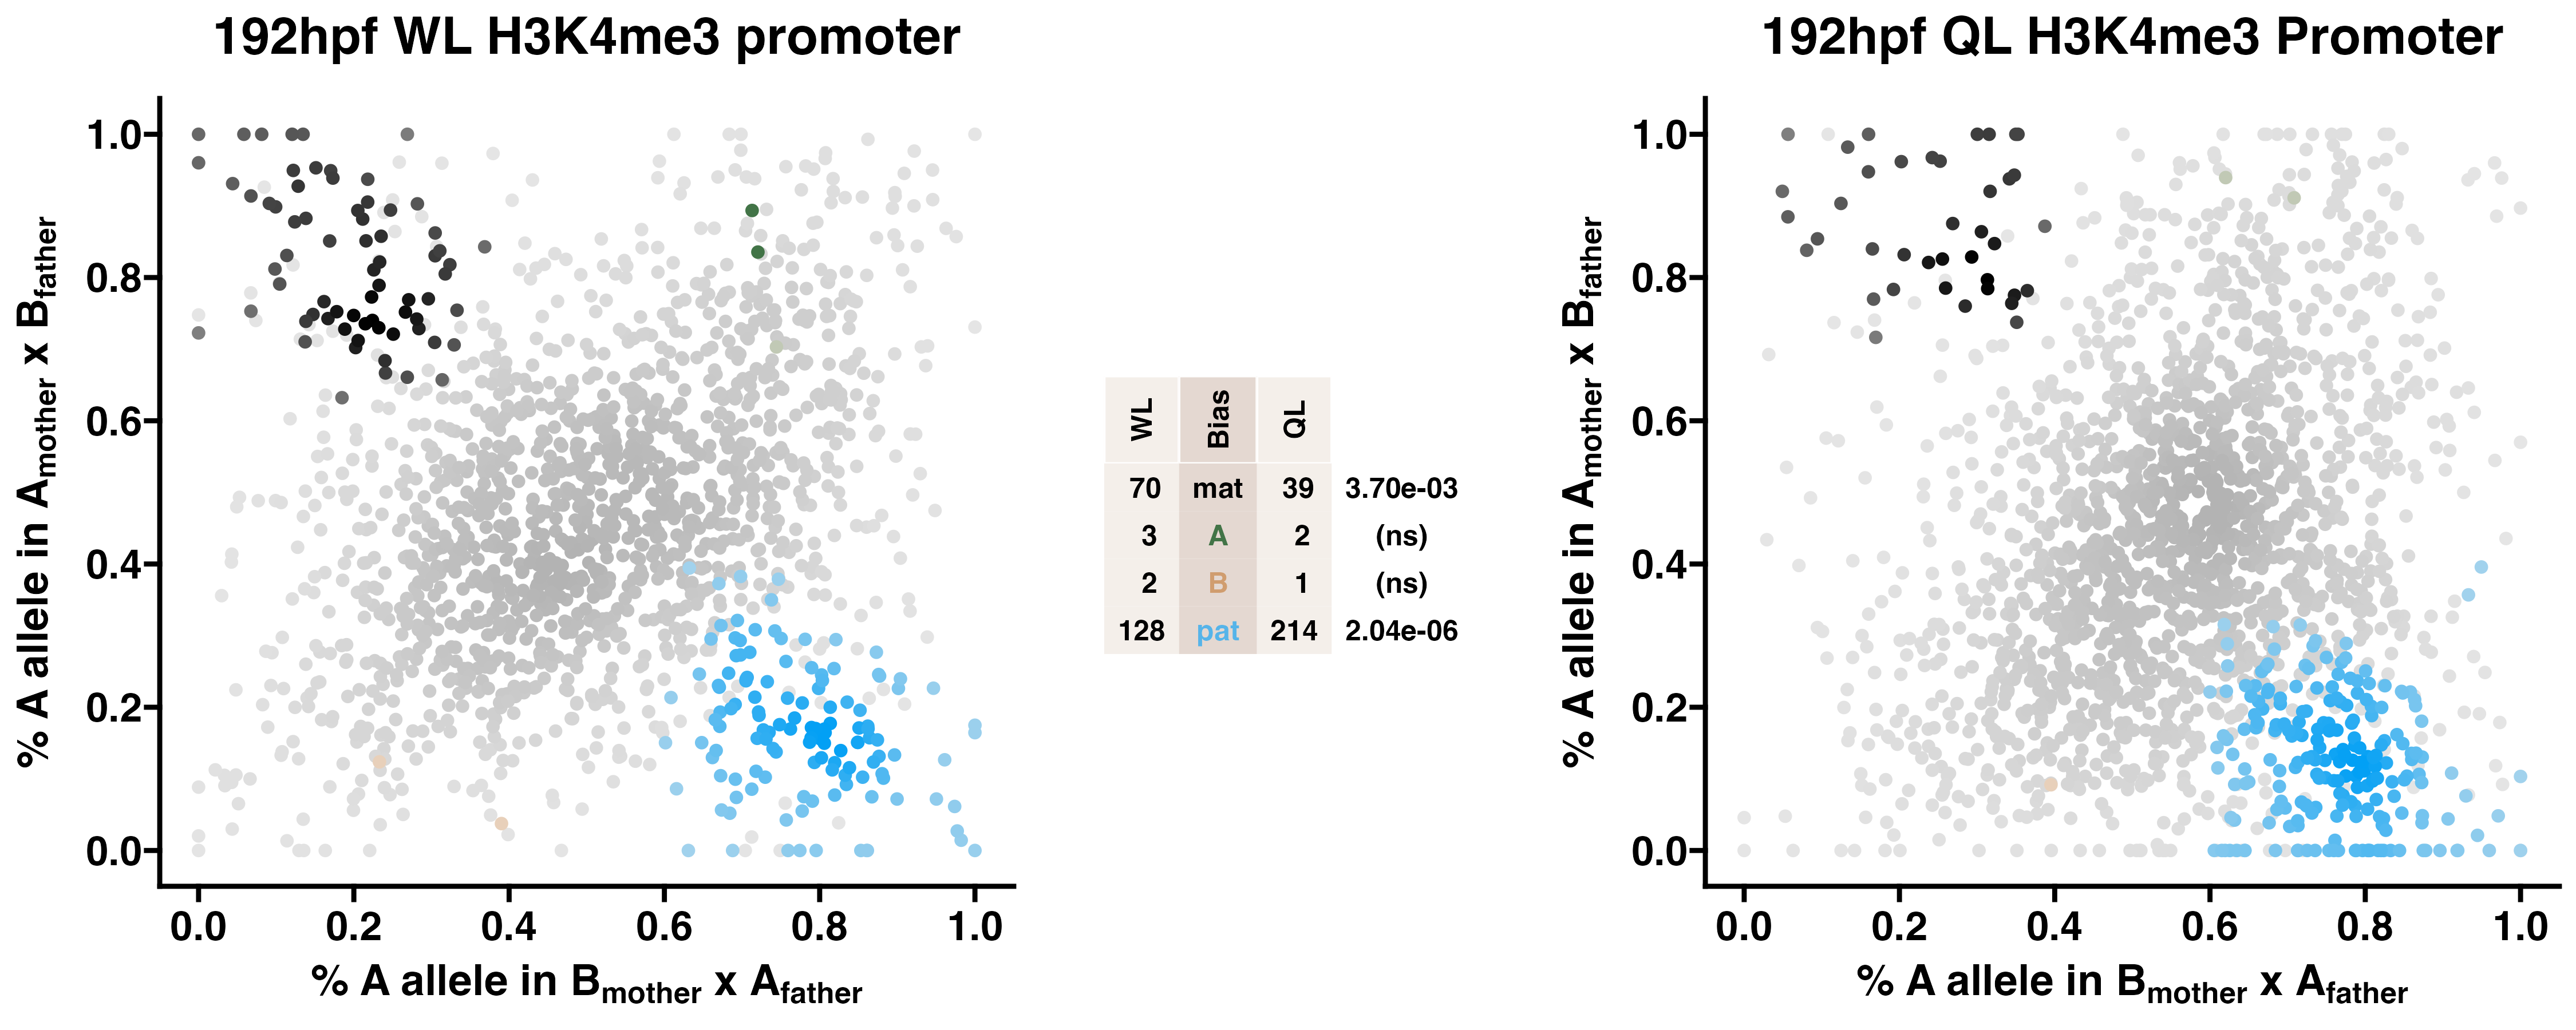
5.5 H3K4me3
Caste differentiation is associated with variation in POEs on H3K4me3 enrichment. Allele-specific enrichment at H3K4me3 peaks were assessed in F2 worker-destined larvae (WL) and queen-destined larvae (QL) at 192hpf collected from a reciprocal cross between different stocks of European honey bees. The x-axis represents, for each peak, the proportion of lineage A reads in bees with a lineage B mother and lineage A father. The y-axis represents, for each peak, the proportion of lineage A reads in bees with a lineage A mother and lineage B father (p2). Each color represents a peak which is significantly biased at all tested SNP positions. Significance was determined using the overlap between two statistical tests: a generalized linear interactive mixed model (GLIMMIX), and a Storer-Kim binomial exact test along with previously established thresholds of p1<0.4 and p2>0.6 for maternal bias, p1>0.6 and p2<0.4 for paternal bias, p1<0.4 and p2<0.4 for lineage B bias and p1>0.6 and p2>0.6 for lineage A bias.
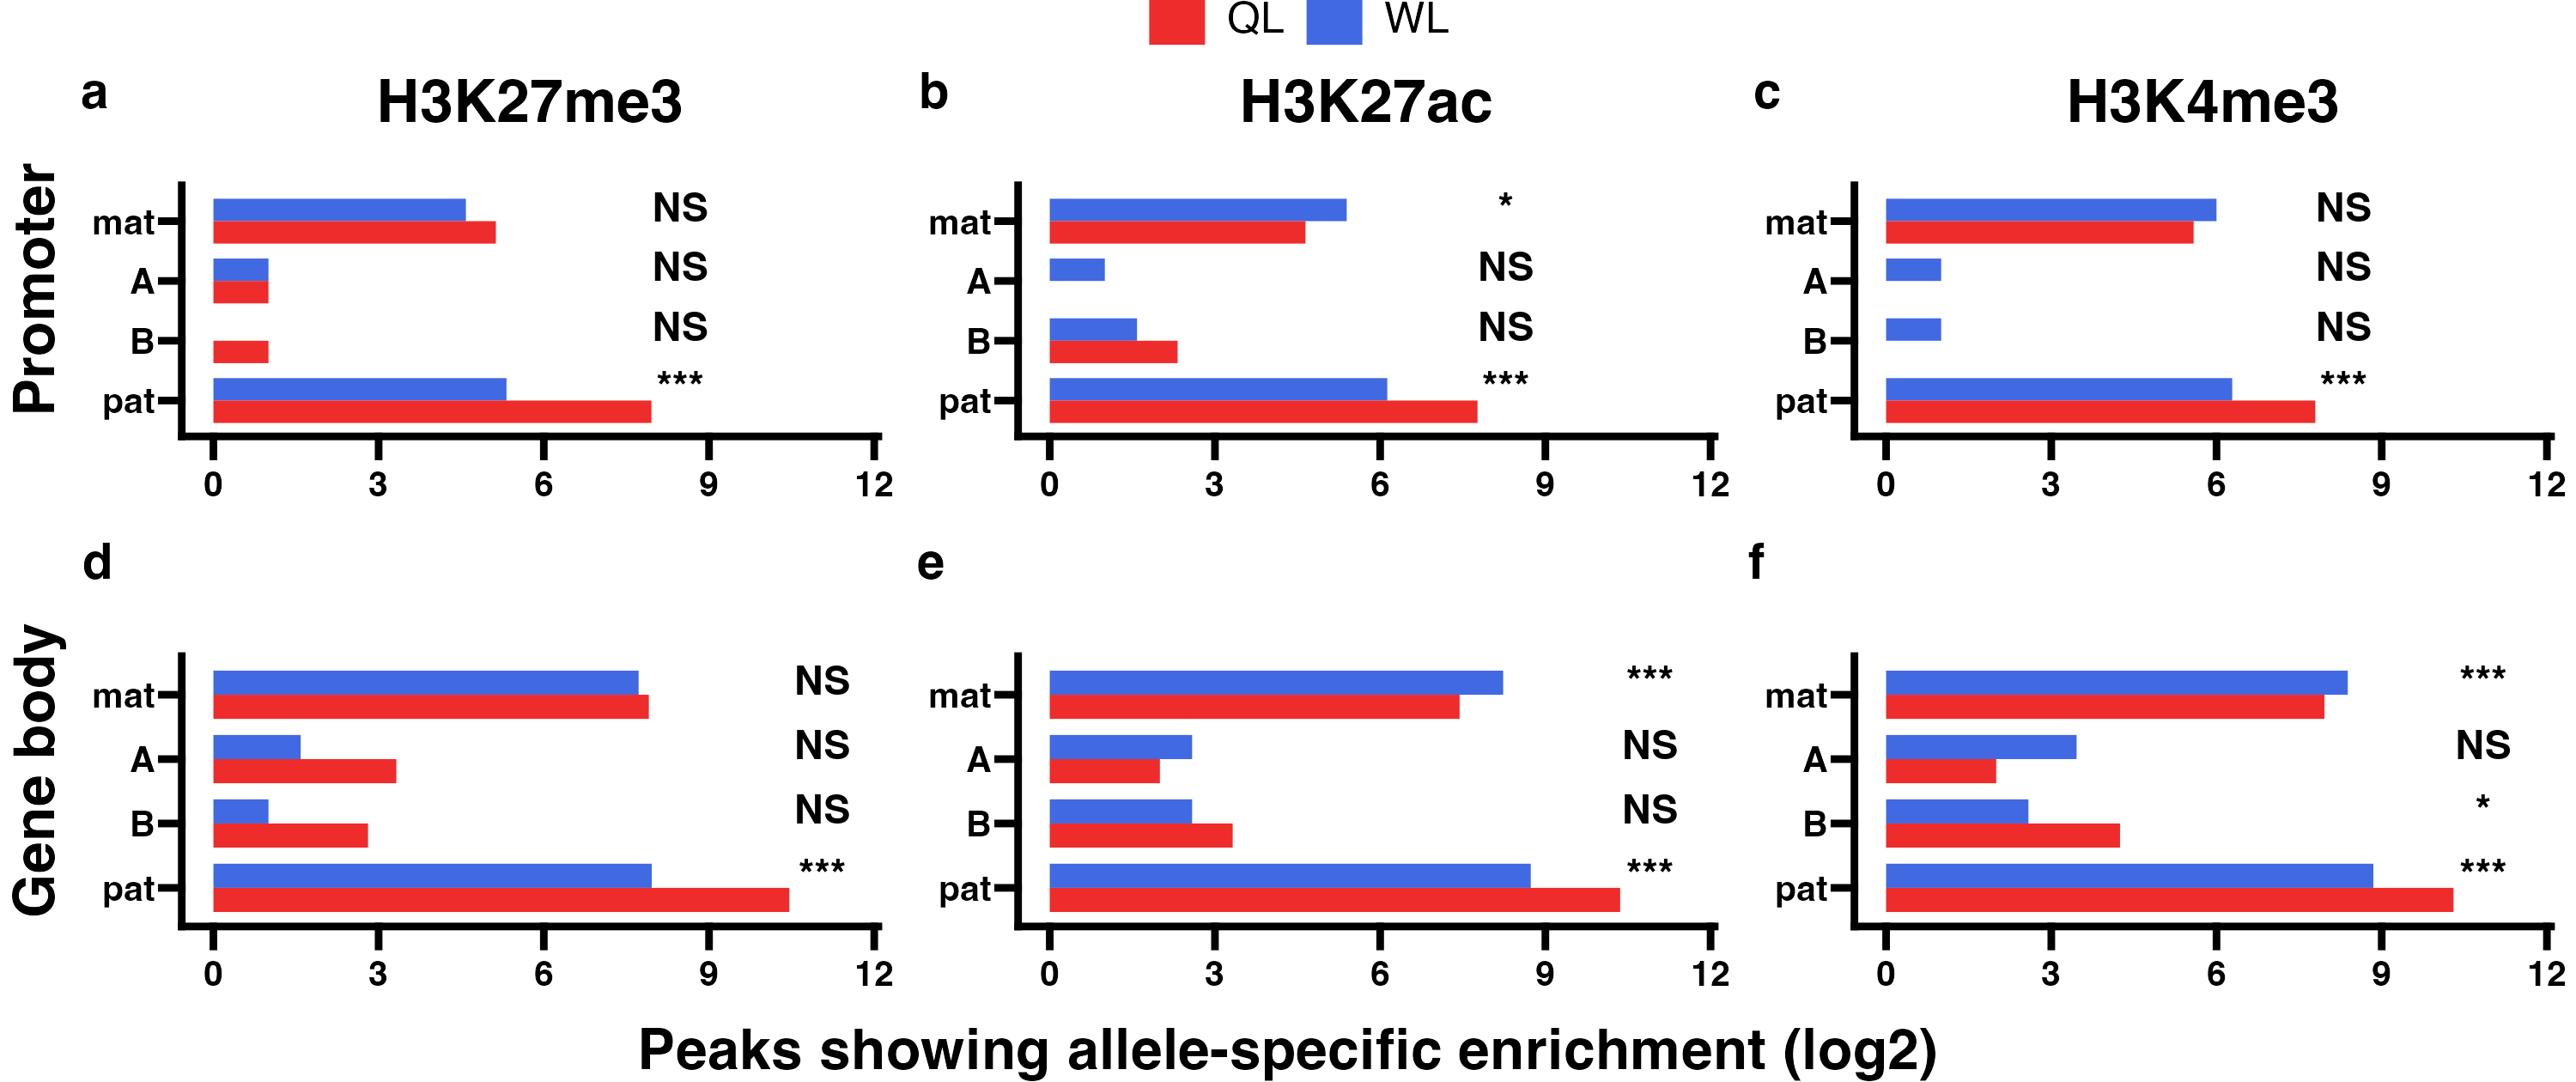
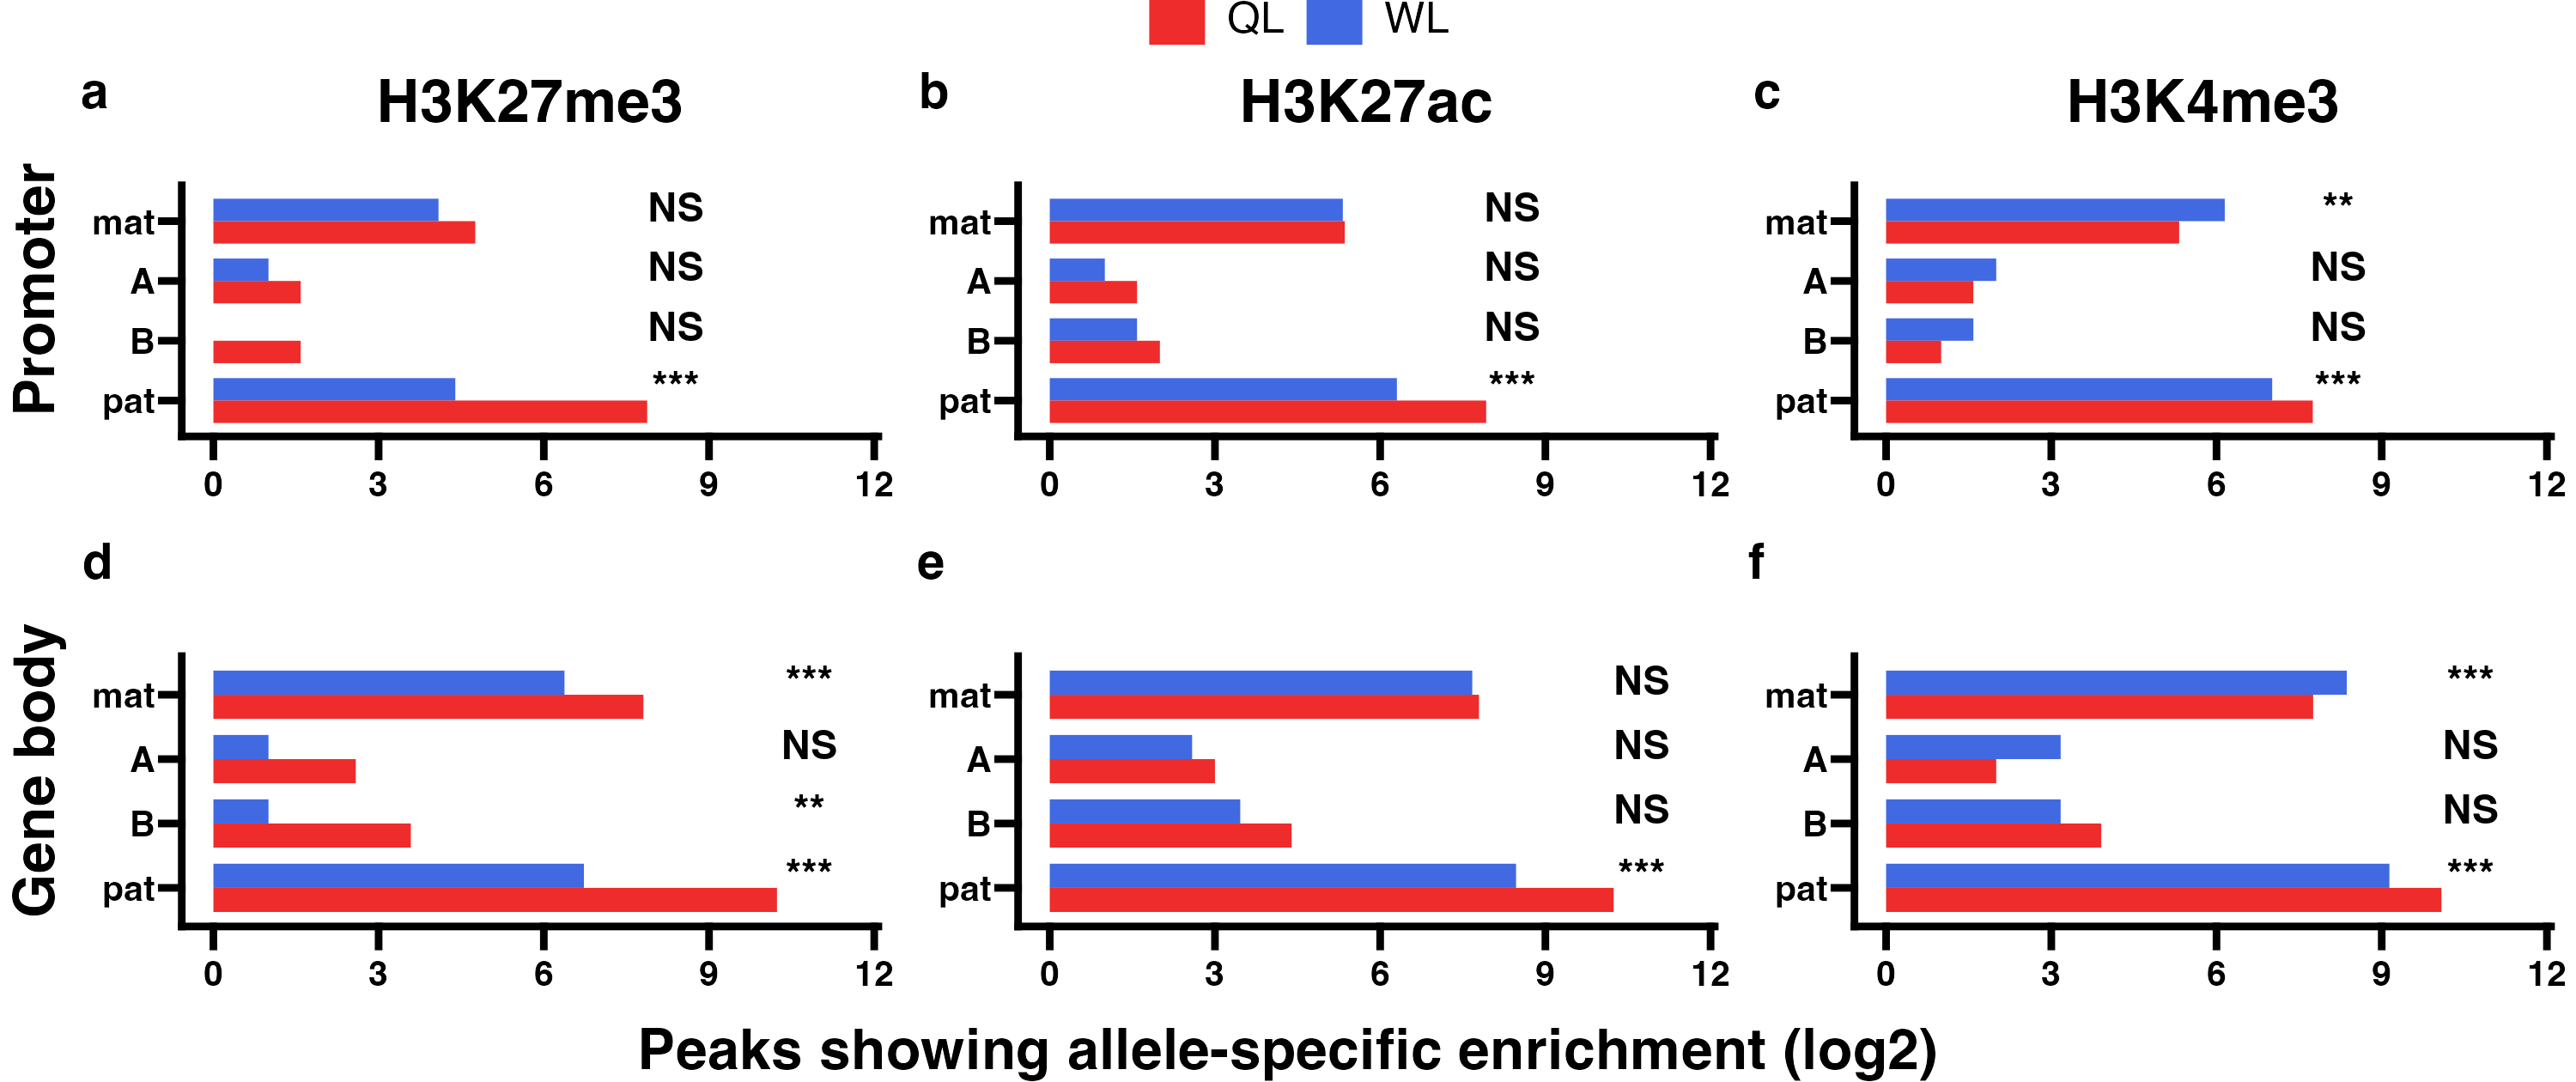
5.6 Combined results
Differences in allelic enrichment of HPTMs across promoters (P) and gene bodies (GB) between queen-destined larvae (QL) and worker-destined larvae (WL) at 192hpf in block 1. The log2 count of peaks showing significant maternal (mat), lineage A, lineage B, or paternal (pat) allele-specific enrichment across (a-c) promoters and (d-f) gene bodies at all tested SNP positions. In each panel, p-values for Chi-squared tests of independence for comparisons between the castes are indicated (NS = not significant, *p<0.01, **p<0.001, ***p<0.001). Significance of allele-biased HPTM enrichment was determined using the overlap between two statistical tests: a general linear mixed model (GLIMMIX), and a Storer-Kim binomial exact test along with previously established thresholds of p1<0.4 and p2>0.6 for maternal bias, p1>0.6 and p2<0.4 for paternal bias, p1<0.4 and p2<0.4 for lineage B bias and p1>0.6 and p2>0.6 for lineage A bias.