S3 Allele-Specific Transcriptomic Analyses
3.1 SNPs and transcripts
| Block | Caste | SNPs | Transcripts | SNPs per Transcript |
|---|---|---|---|---|
| 1 | WL | 86290 | 5734 | 15.05 |
| 1 | QL | 86415 | 5752 | 15.02 |
| 2 | WL | 65361 | 4513 | 14.48 |
| 2 | QL | 65490 | 4553 | 14.38 |
| 3 | egg | 45486 | 4178 | 10.89 |
| 4 | egg | 45976 | 4062 | 11.32 |
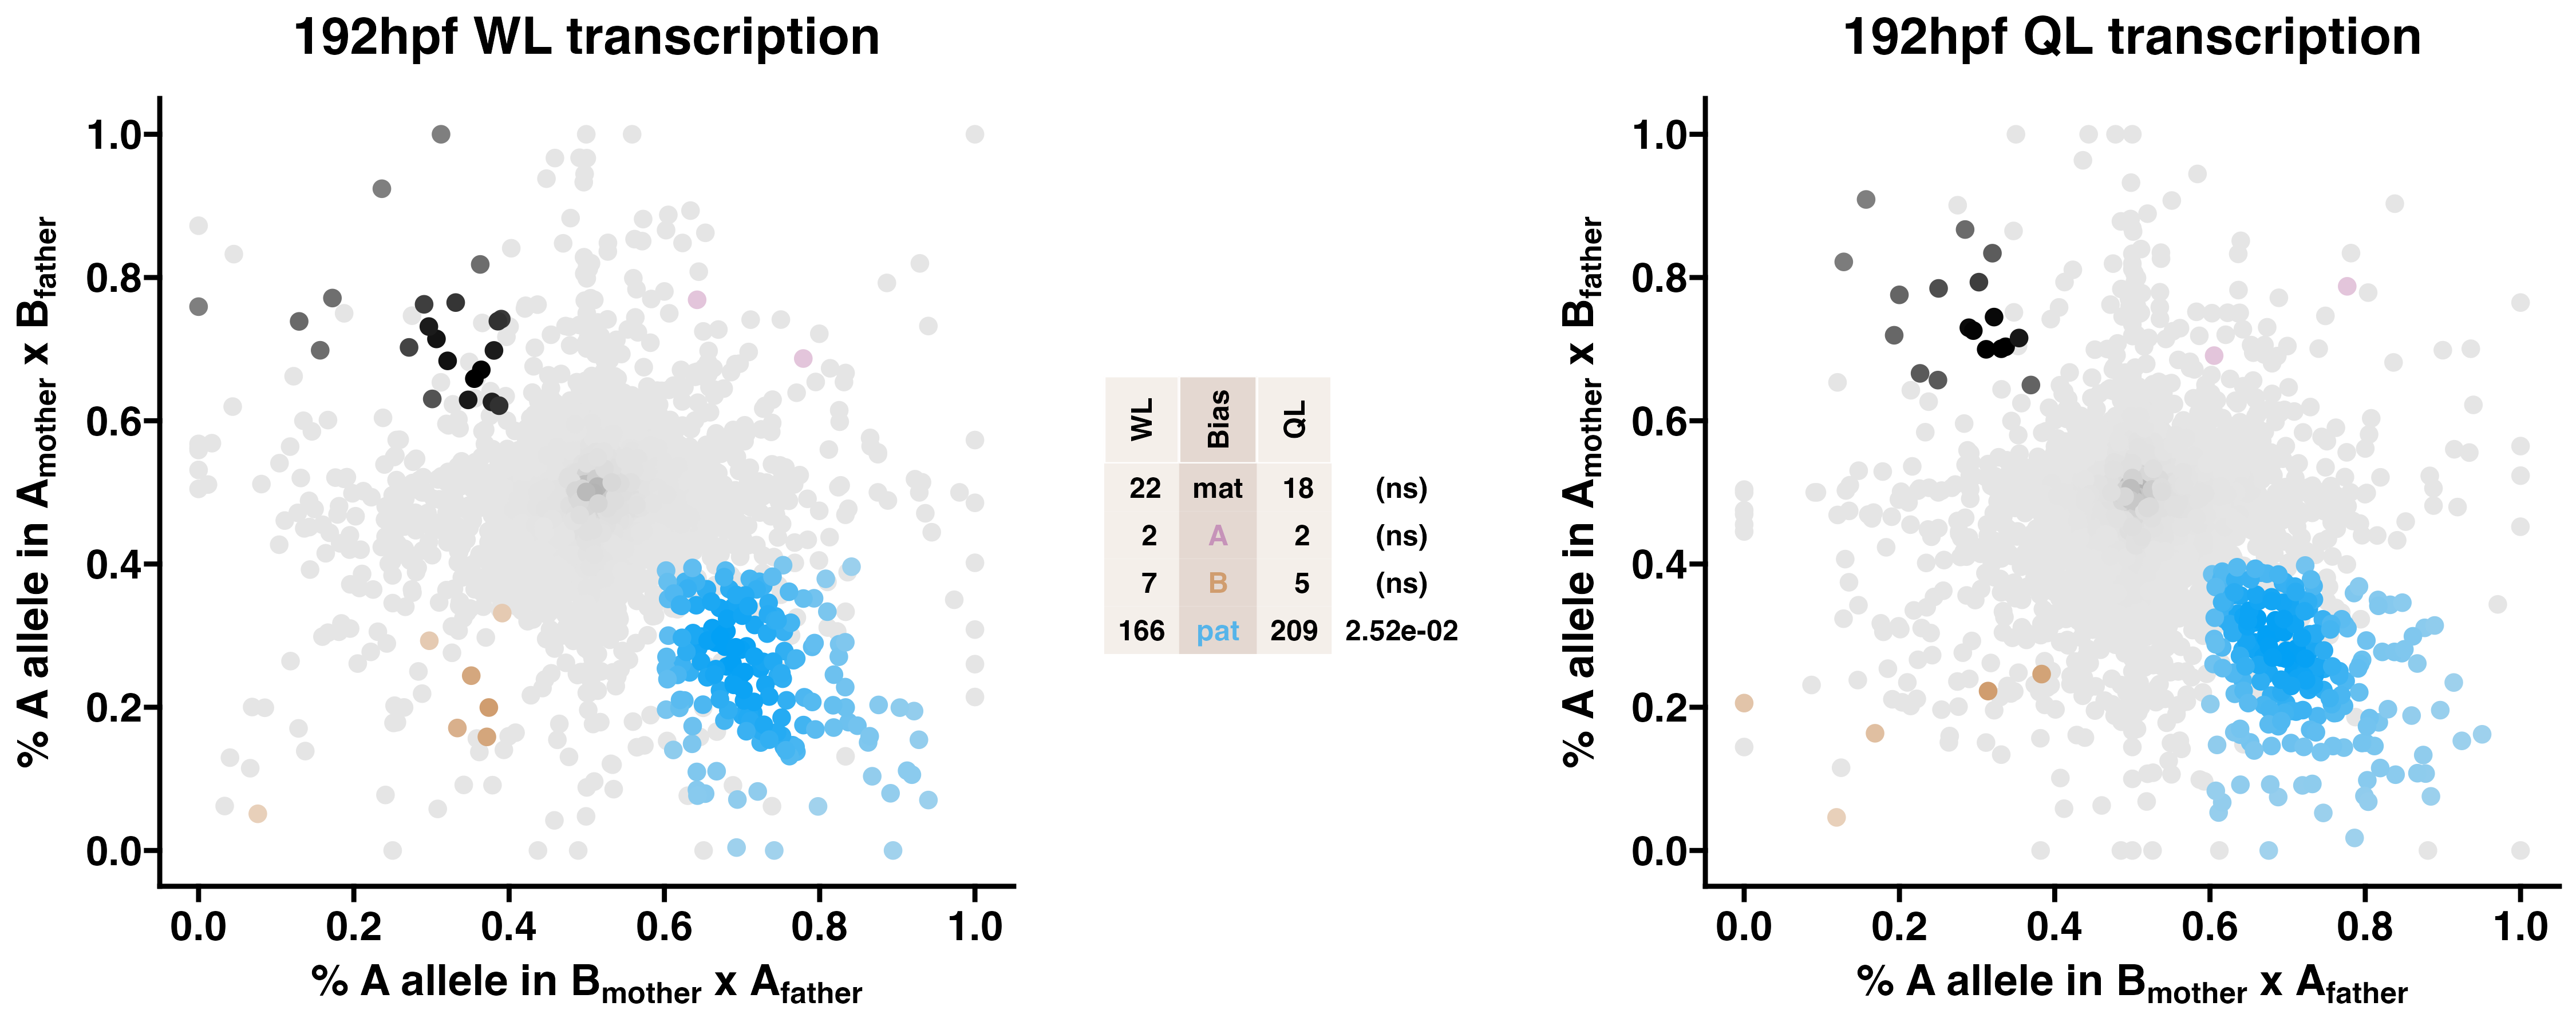
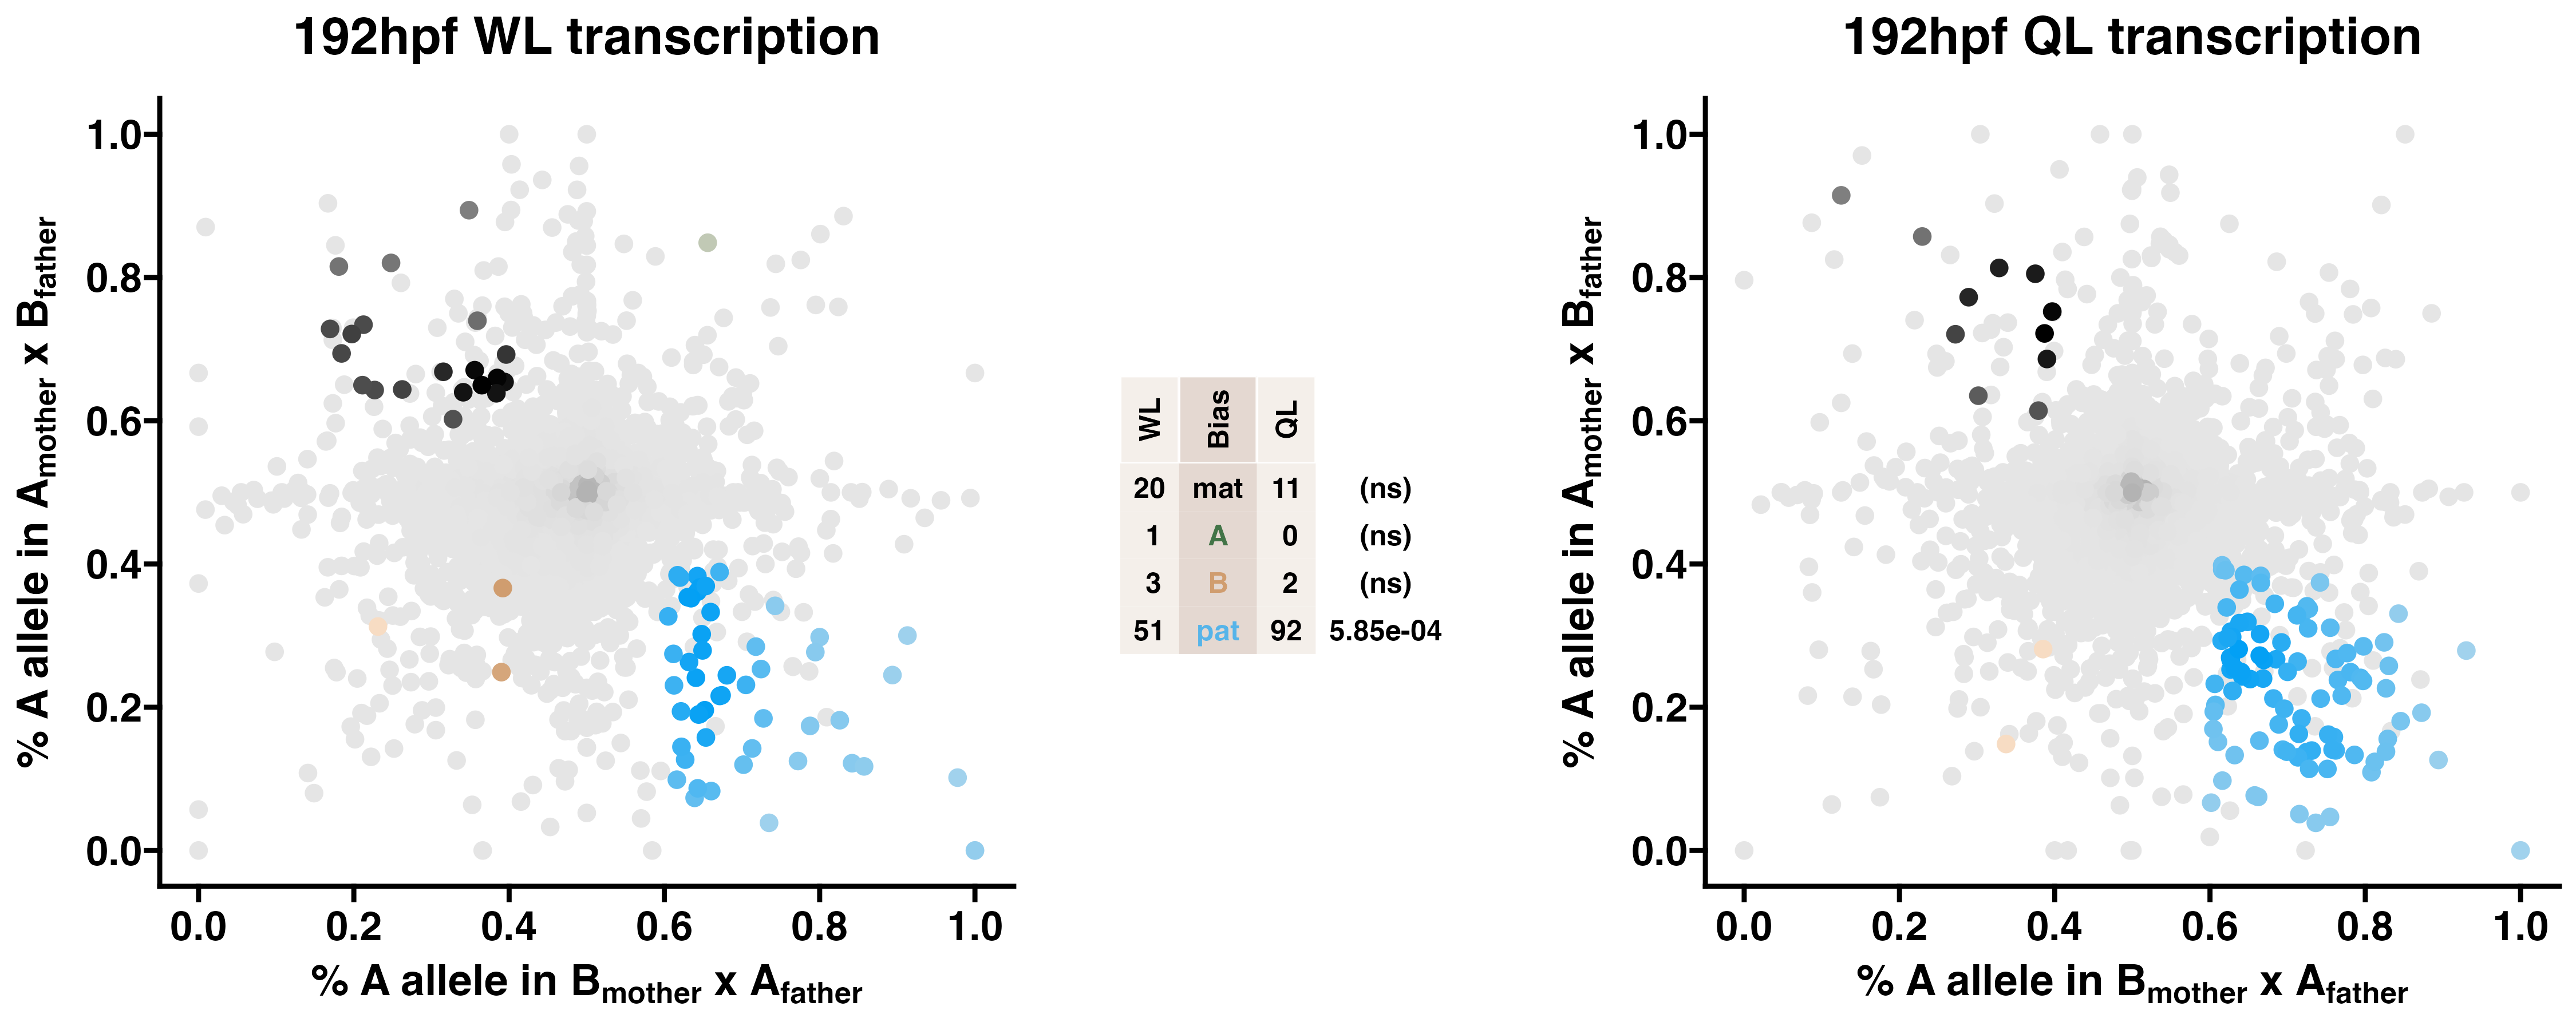
3.3 192hpf WL & QL - allelic transcriptomics
Queen-destined larvae show enriched paternal allele-biased transcription relative to worker-destined larvae. Allele-specific transcriptomes were assessed in F2 worker-destined larvae (WL) and queen-destined larvae (QL) at 192hpf collected from a reciprocal cross between different stocks of European honey bees. The x-axis represents, for each transcript, the proportion of lineage A reads in bees with a lineage B mother and lineage A father (p1). The y-axis represents, for each transcript, the proportion of lineage A reads in bees with a lineage A mother and lineage B father (p2). Each color represents a transcript which is significantly biased at all tested SNP positions: black is maternal (mat), green is lineage A, gold is lineage B, blue is paternal (pat), and grey is not significant. Center table: the number of transcripts showing each category of allelic bias and p-values for Chi-squared tests of independence for comparisons between the castes are indicated (NS = not significant, *p<0.01, **p<0.001, ***p<0.001). Significance of allele-biased transcription was determined using the overlap between two statistical tests: a general linear mixed model (GLIMMIX), and a Storer-Kim binomial exact test along with previously established thresholds of p1<0.4 and p2>0.6 for maternal bias, p1>0.6 and p2<0.4 for paternal bias, p1<0.4 and p2<0.4 for lineage B bias and p1>0.6 and p2>0.6 for lineage A bias.
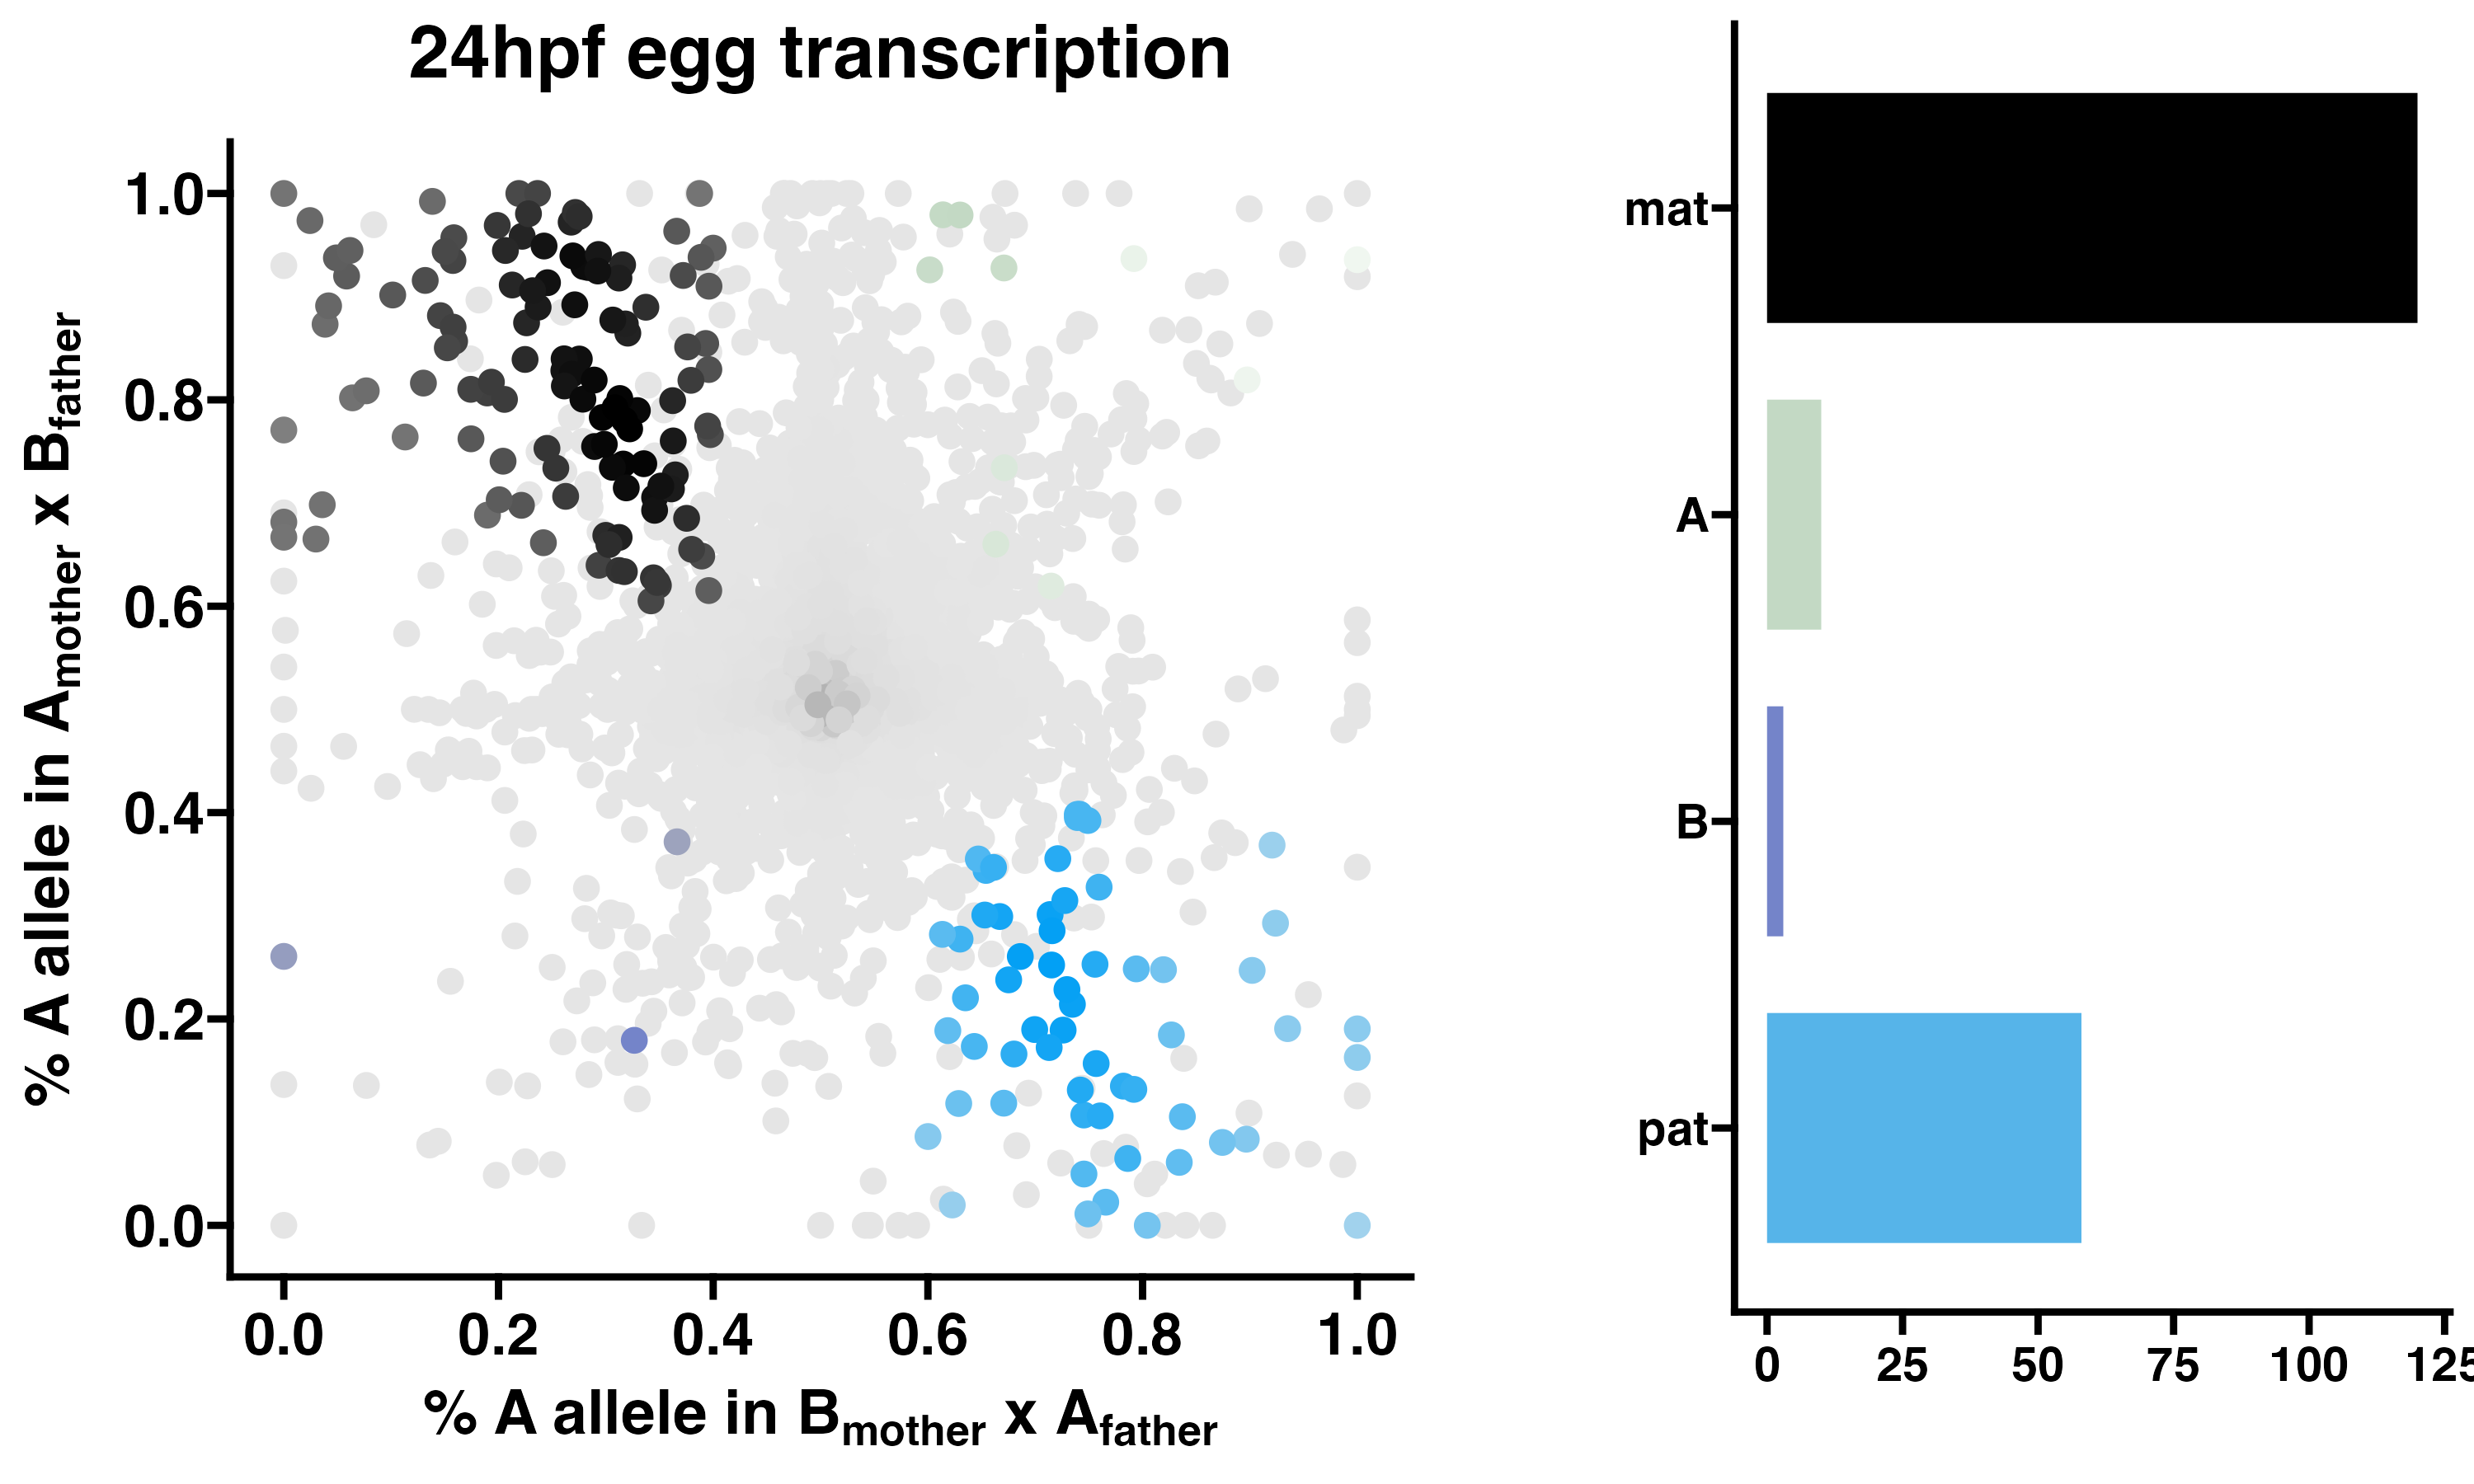
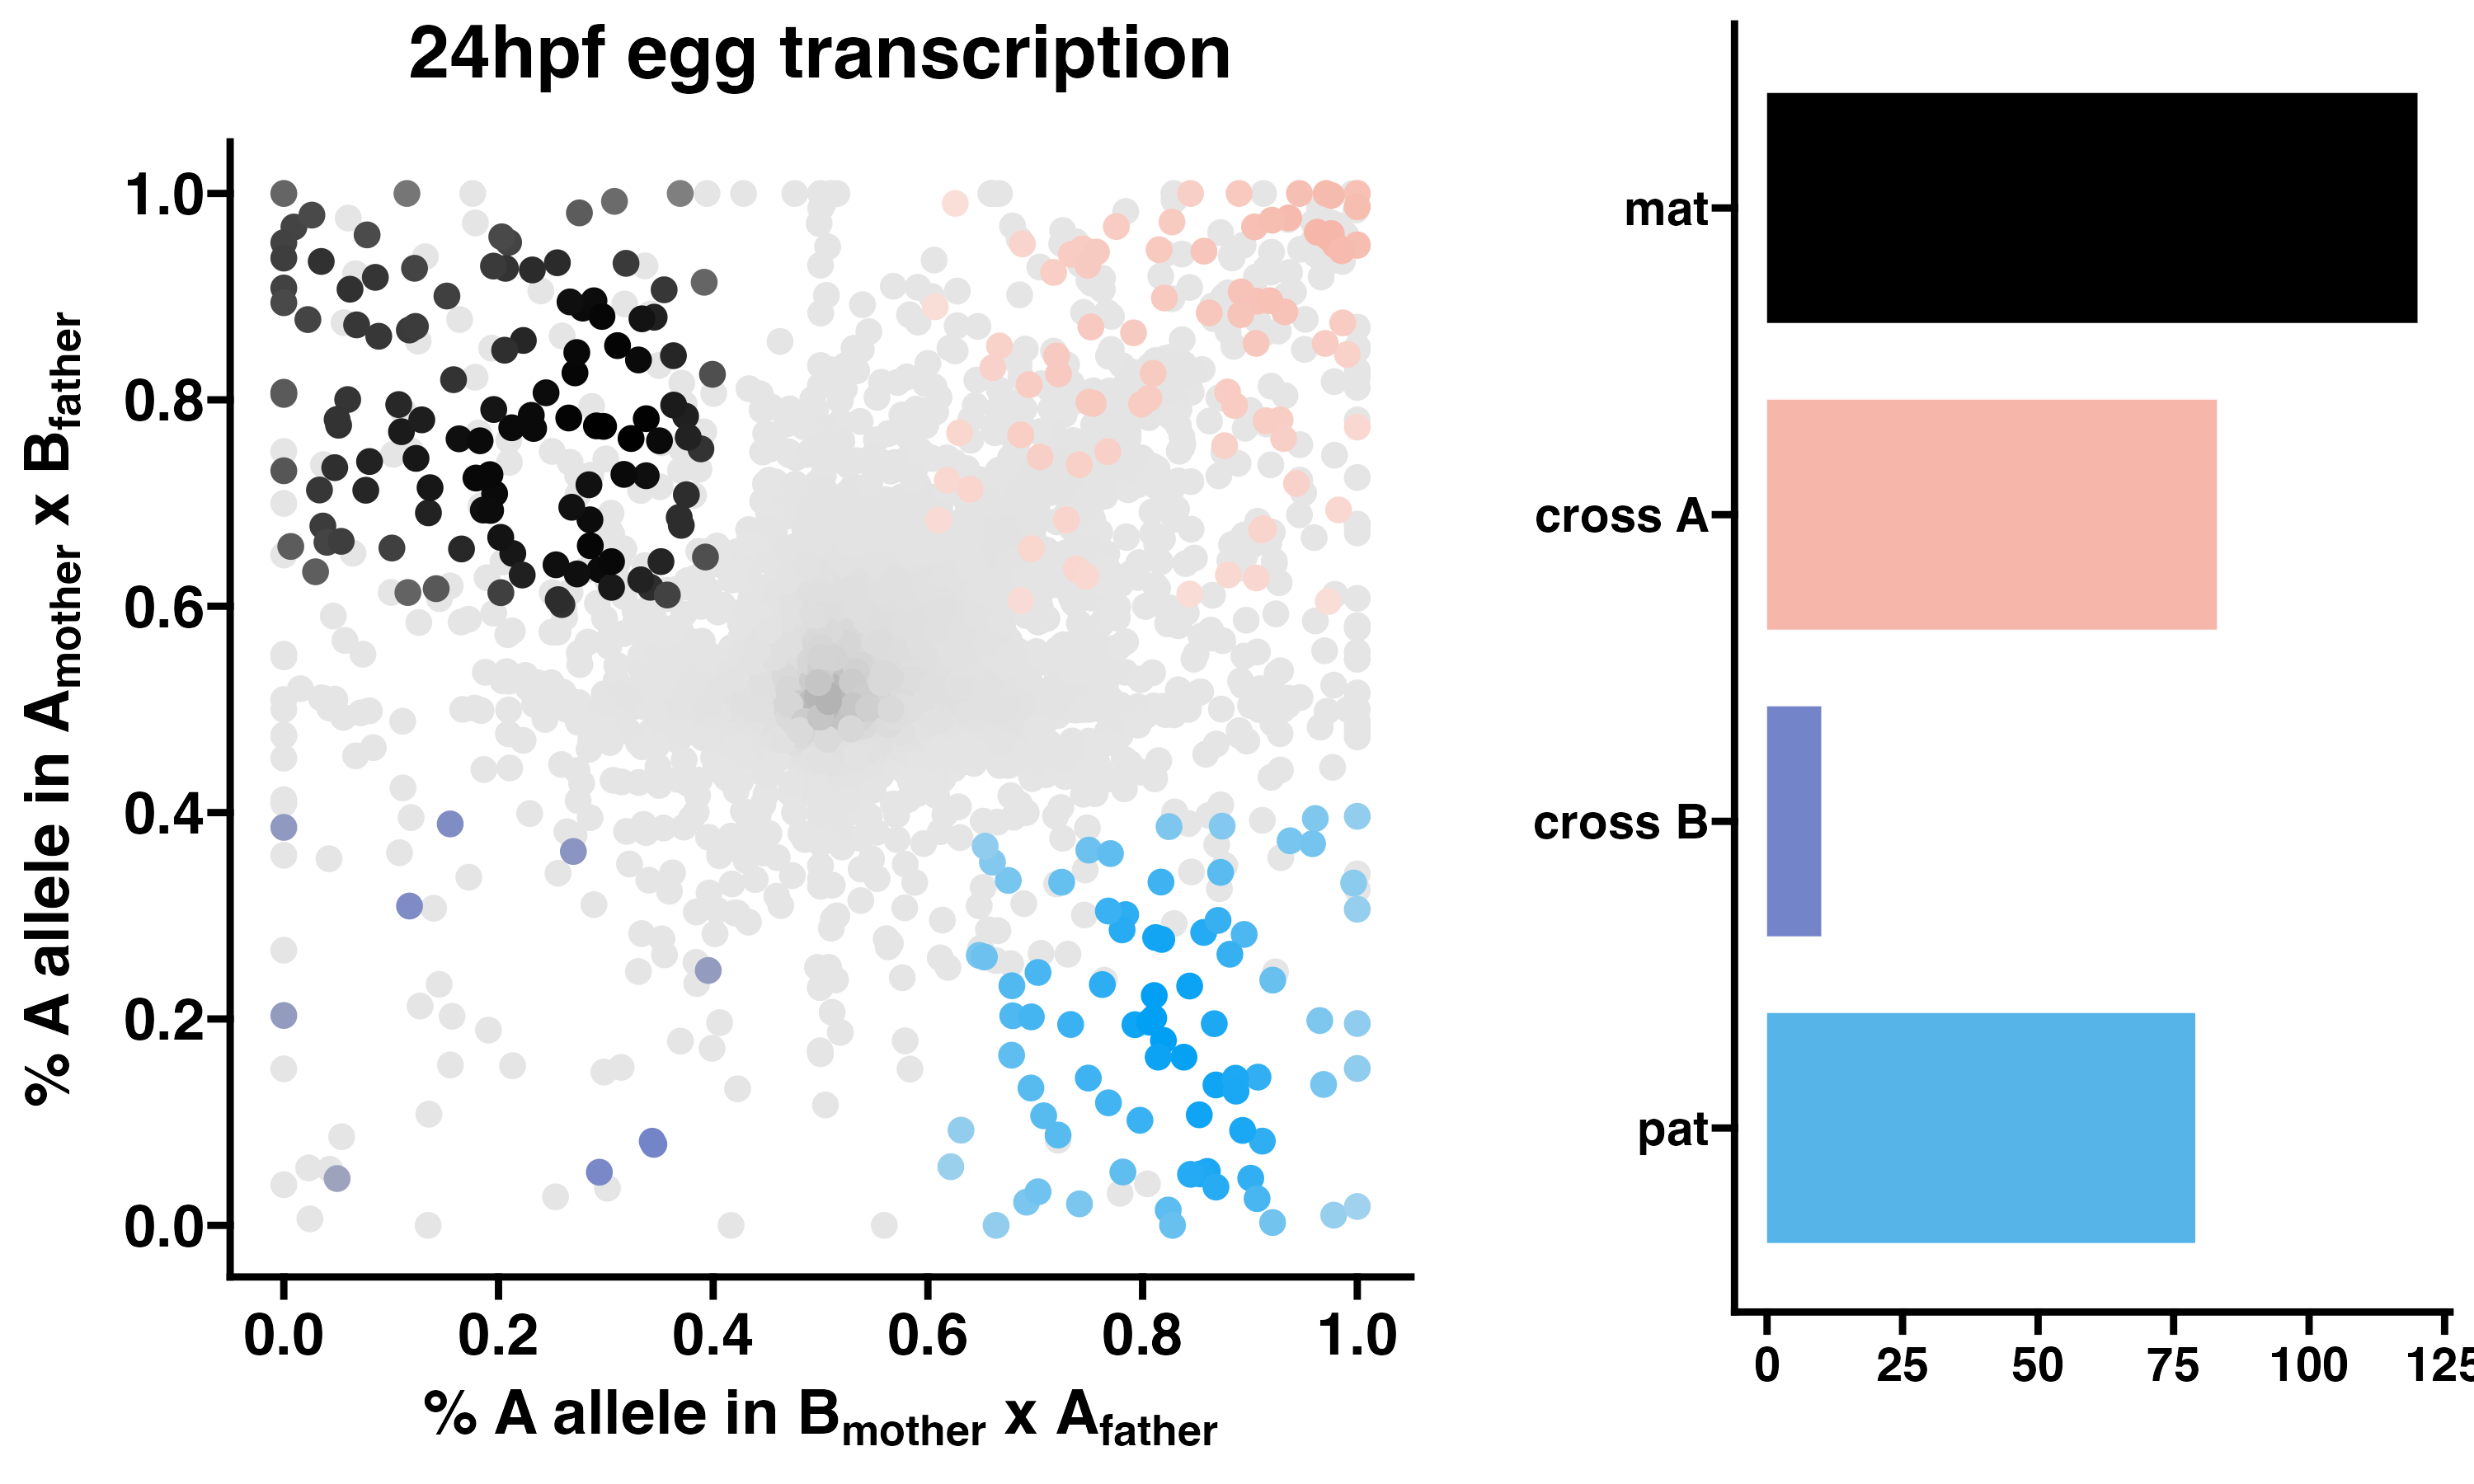
3.4 24hpf eggs - allelic transcriptomics
POEs on transcription in F2 eggs at 24hpf. Allele-specific transcriptomes were assessed in reciprocal crosses between different stocks of European honey bees. The x-axis represents, for each transcript, the proportion of lineage A reads in eggs with a lineage B mother and lineage A father (p1). The y-axis represents, for each transcript, the proportion of lineage A reads in eggs with a lineage A mother and lineage B father (p2). Each color represents a transcript which is significantly biased at all tested SNP positions: black is maternal (mat), green is lineage A, purple is lineage B, blue is paternal (pat), and grey is not significant. Significance of allele-biased transcription was determined using the overlap between two statistical tests: a general linear mixed model (GLIMMIX), and a Storer-Kim binomial exact test along with previously established thresholds of p1<0.4 and p2>0.6 for maternal bias, p1>0.6 and p2<0.4 for paternal bias, p1<0.4 and p2<0.4 for lineage B bias and p1>0.6 and p2>0.6 for lineage A bias.