Intron feature analyses
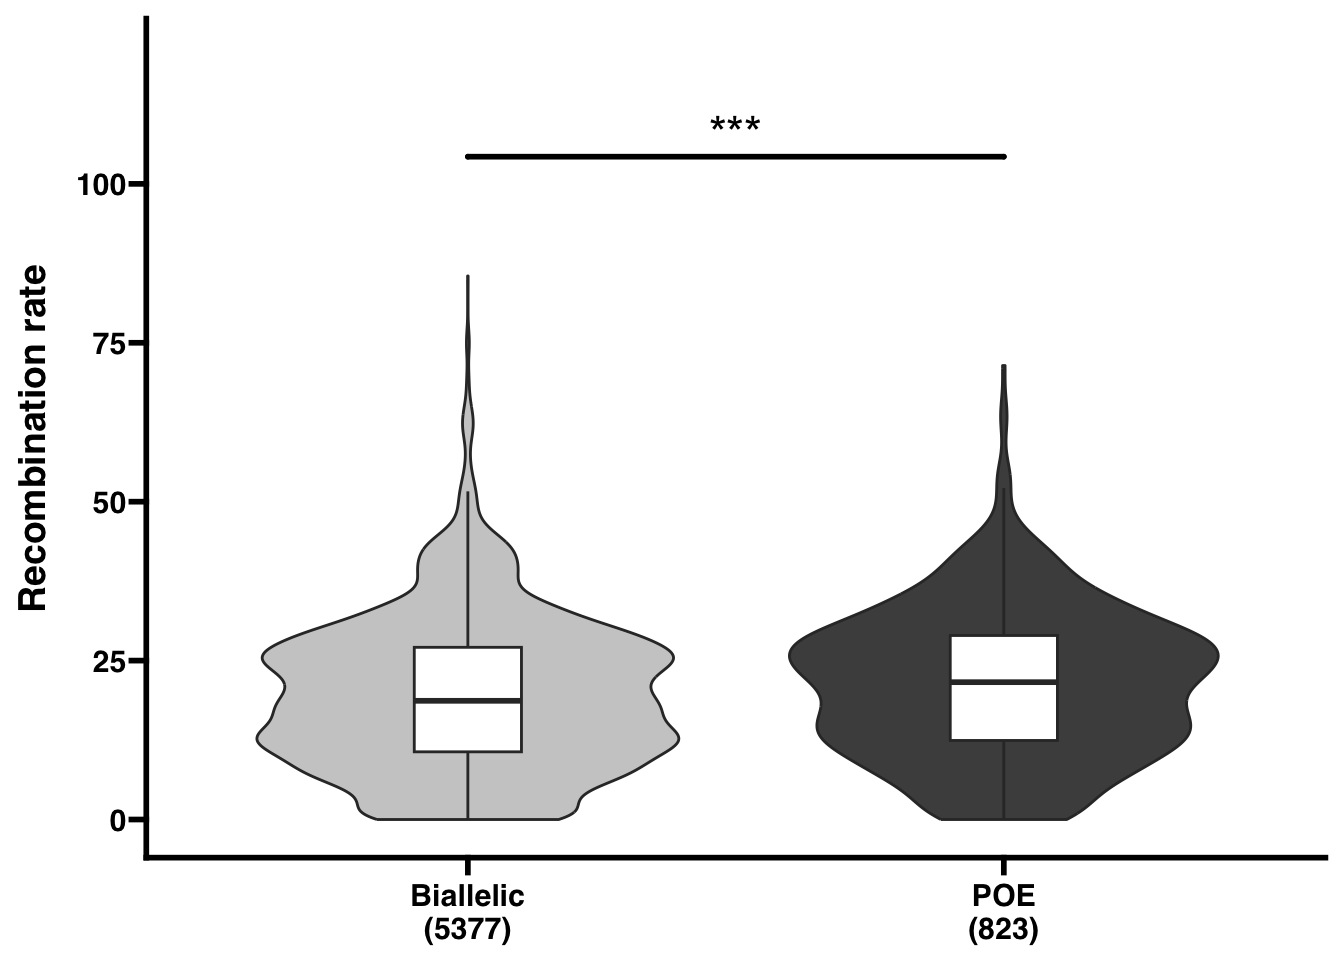
Recombination rate
##
## Biallelic       POE
##      5377       823
##
##  Welch Two Sample t-test
##
## data:  recomb by PSGE
## t = -3.6936, df = 1106.2, p-value = 0.0002319
## alternative hypothesis: true difference in means between group Biallelic and group POE is not equal to 0
## 95 percent confidence interval:
##  -2.4838282 -0.7604234
## sample estimates:
## mean in group Biallelic       mean in group POE
##                19.60765                21.22978
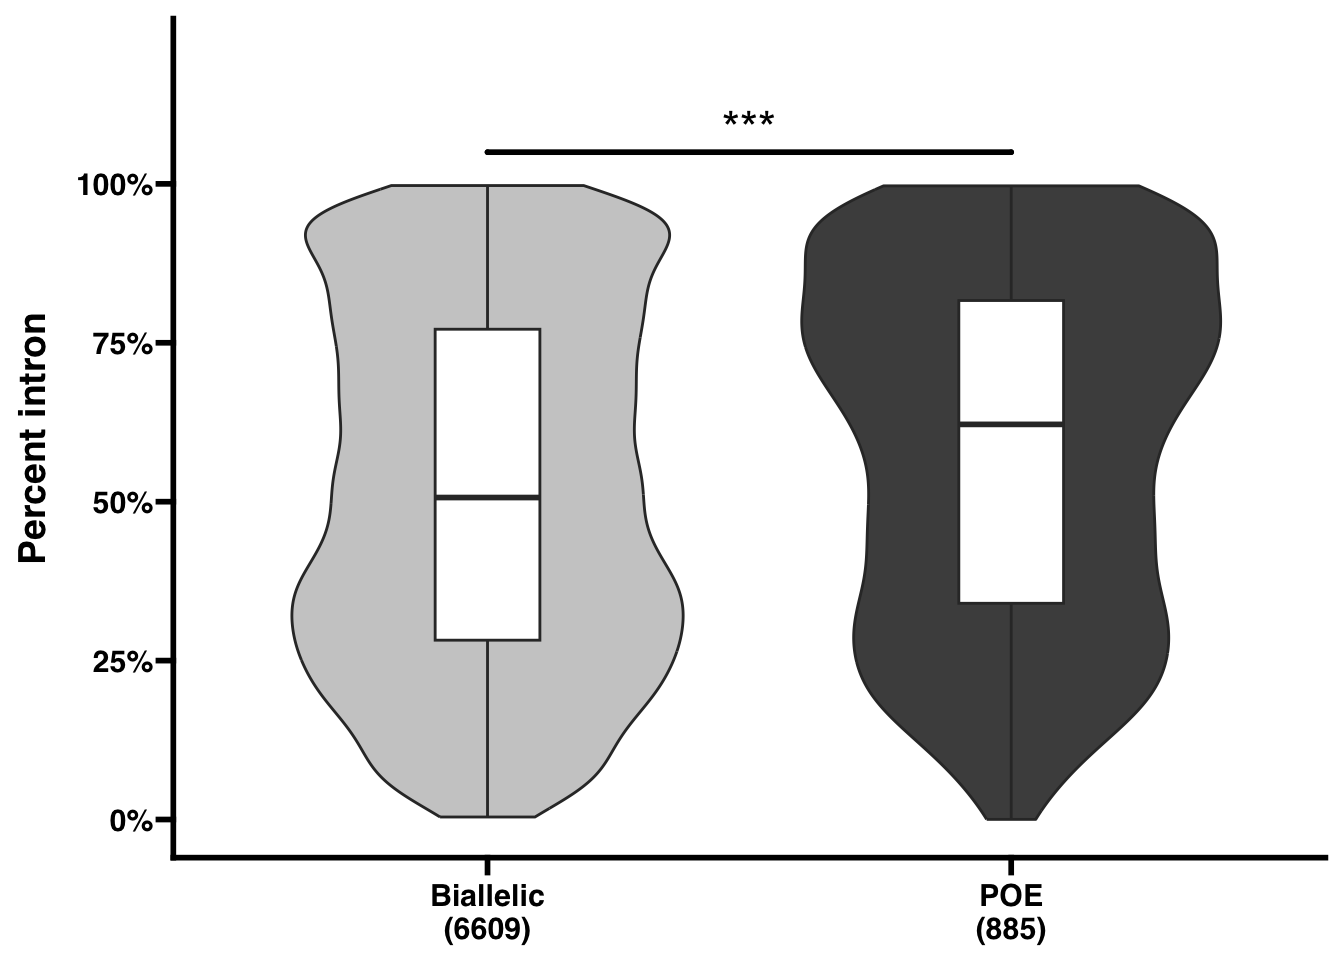
% intron
##
## Biallelic       POE
##      6609       885
##
##  Welch Two Sample t-test
##
## data:  pctintron by PSGE
## t = -6.6588, df = 1148, p-value = 4.271e-11
## alternative hypothesis: true difference in means between group Biallelic and group POE is not equal to 0
## 95 percent confidence interval:
##  -0.08463530 -0.04611052
## sample estimates:
## mean in group Biallelic       mean in group POE
##               0.5197719               0.5851448
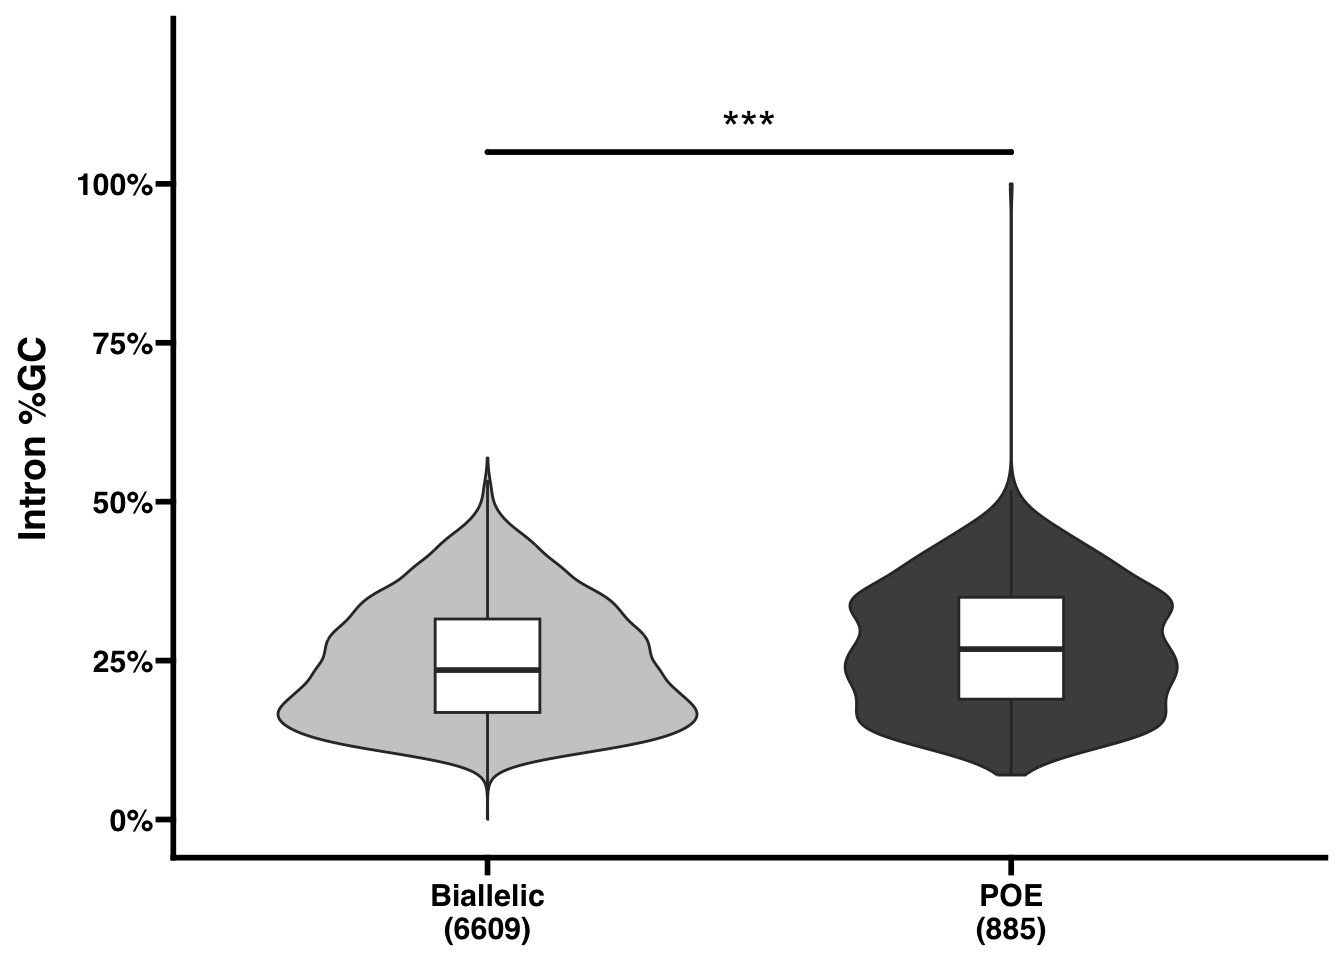
Intron GC
##
## Biallelic       POE
##      6609       885
##
##  Welch Two Sample t-test
##
## data:  GCpercent by PSGE
## t = -7.1792, df = 1098.4, p-value = 1.289e-12
## alternative hypothesis: true difference in means between group Biallelic and group POE is not equal to 0
## 95 percent confidence interval:
##  -0.03293546 -0.01879670
## sample estimates:
## mean in group Biallelic       mean in group POE
##               0.2465887               0.2724548
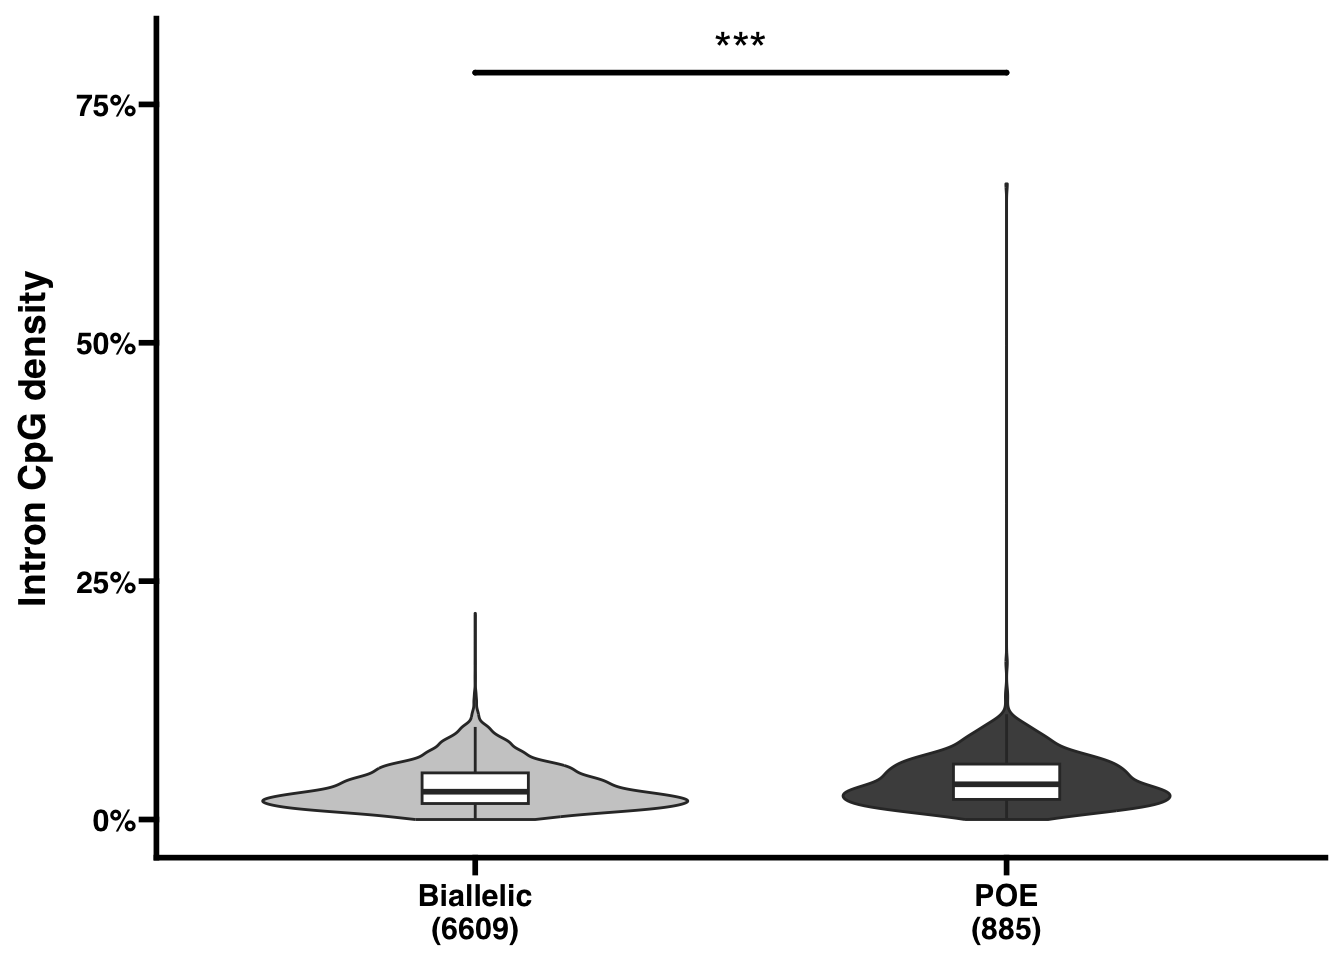
Intron CpG density
##
## Biallelic       POE
##      6609       885
##
##  Welch Two Sample t-test
##
## data:  GCdens by PSGE
## t = -6.3152, df = 1009.8, p-value = 4.036e-10
## alternative hypothesis: true difference in means between group Biallelic and group POE is not equal to 0
## 95 percent confidence interval:
##  -0.009421369 -0.004954411
## sample estimates:
## mean in group Biallelic       mean in group POE
##              0.03452846              0.04171635