S4 ChIP-seq Analysis
4.1 Enrichment across promoters and gene bodies
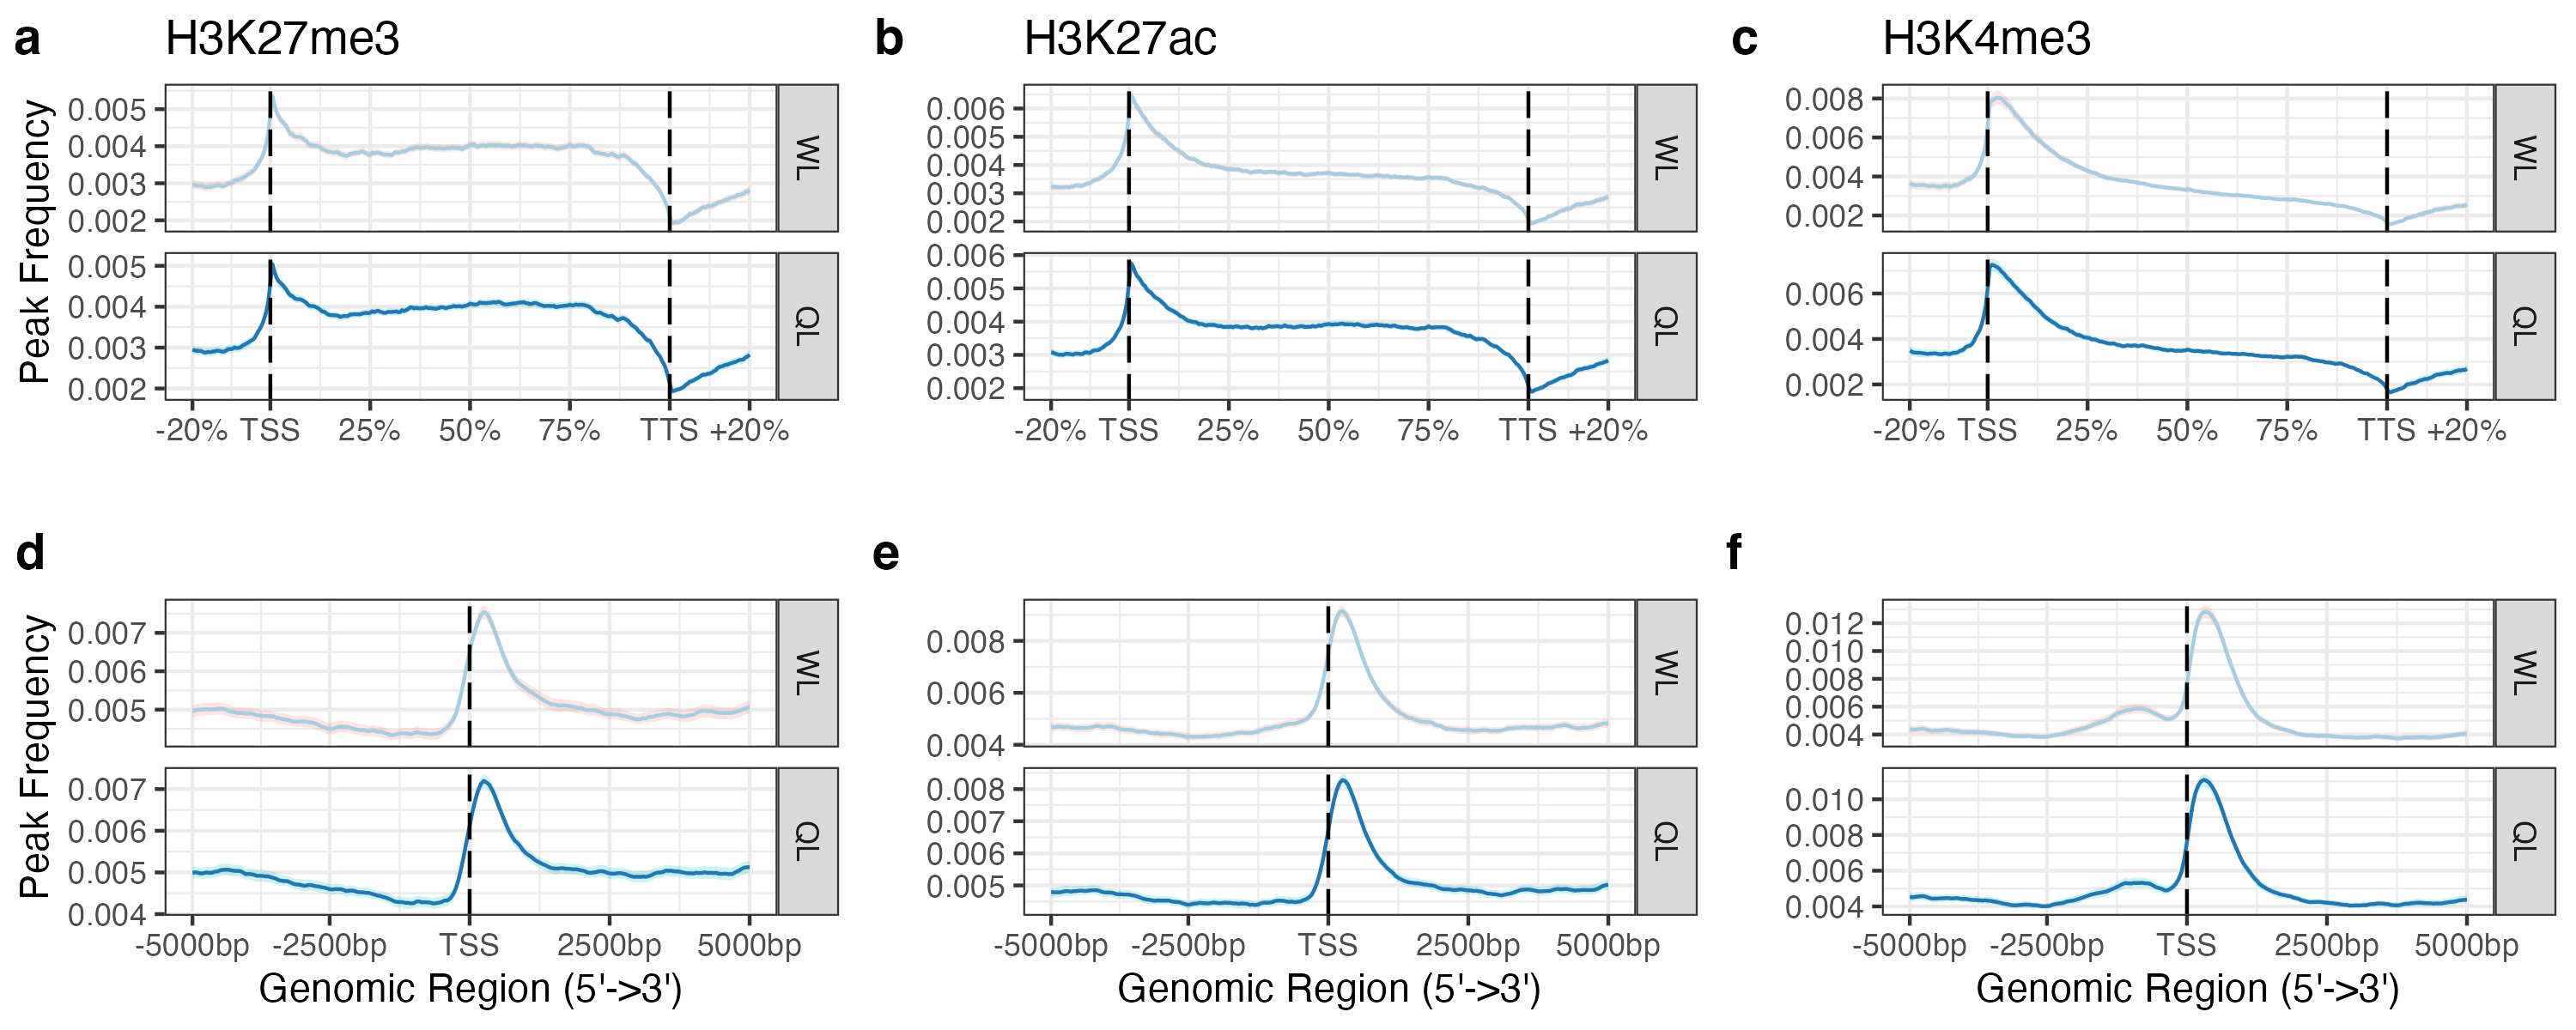
Frequency and distribution of HPTM peaks across gene bodies (a-c) and 5kb regions centered around transcription start sites (TSS) (d-f) in worker-destined larvae (WL) and queen-destined larvae (QL) at 192hpf. 95% confidence intervals are indicated.
4.2 Differential enrichment analysis
Descriptive statistics of windows and regions assessed for differential HPTM enrichment.
| HPTM | Windows | Windows after filtering | Percent of total | Merged regions | Mean region length | SD region length |
|---|---|---|---|---|---|---|
| H3K27me3 | 1472315 | 712081 | 48.36 | 30778 | 4635 | 2875 |
| H3K27ac | 1472072 | 702892 | 47.75 | 31993 | 4469 | 2808 |
| H3K4me3 | 1471353 | 712097 | 48.40 | 32518 | 4451 | 2817 |