Appendix D-2 Transcriptomic Analyses
2.2 WGCNA
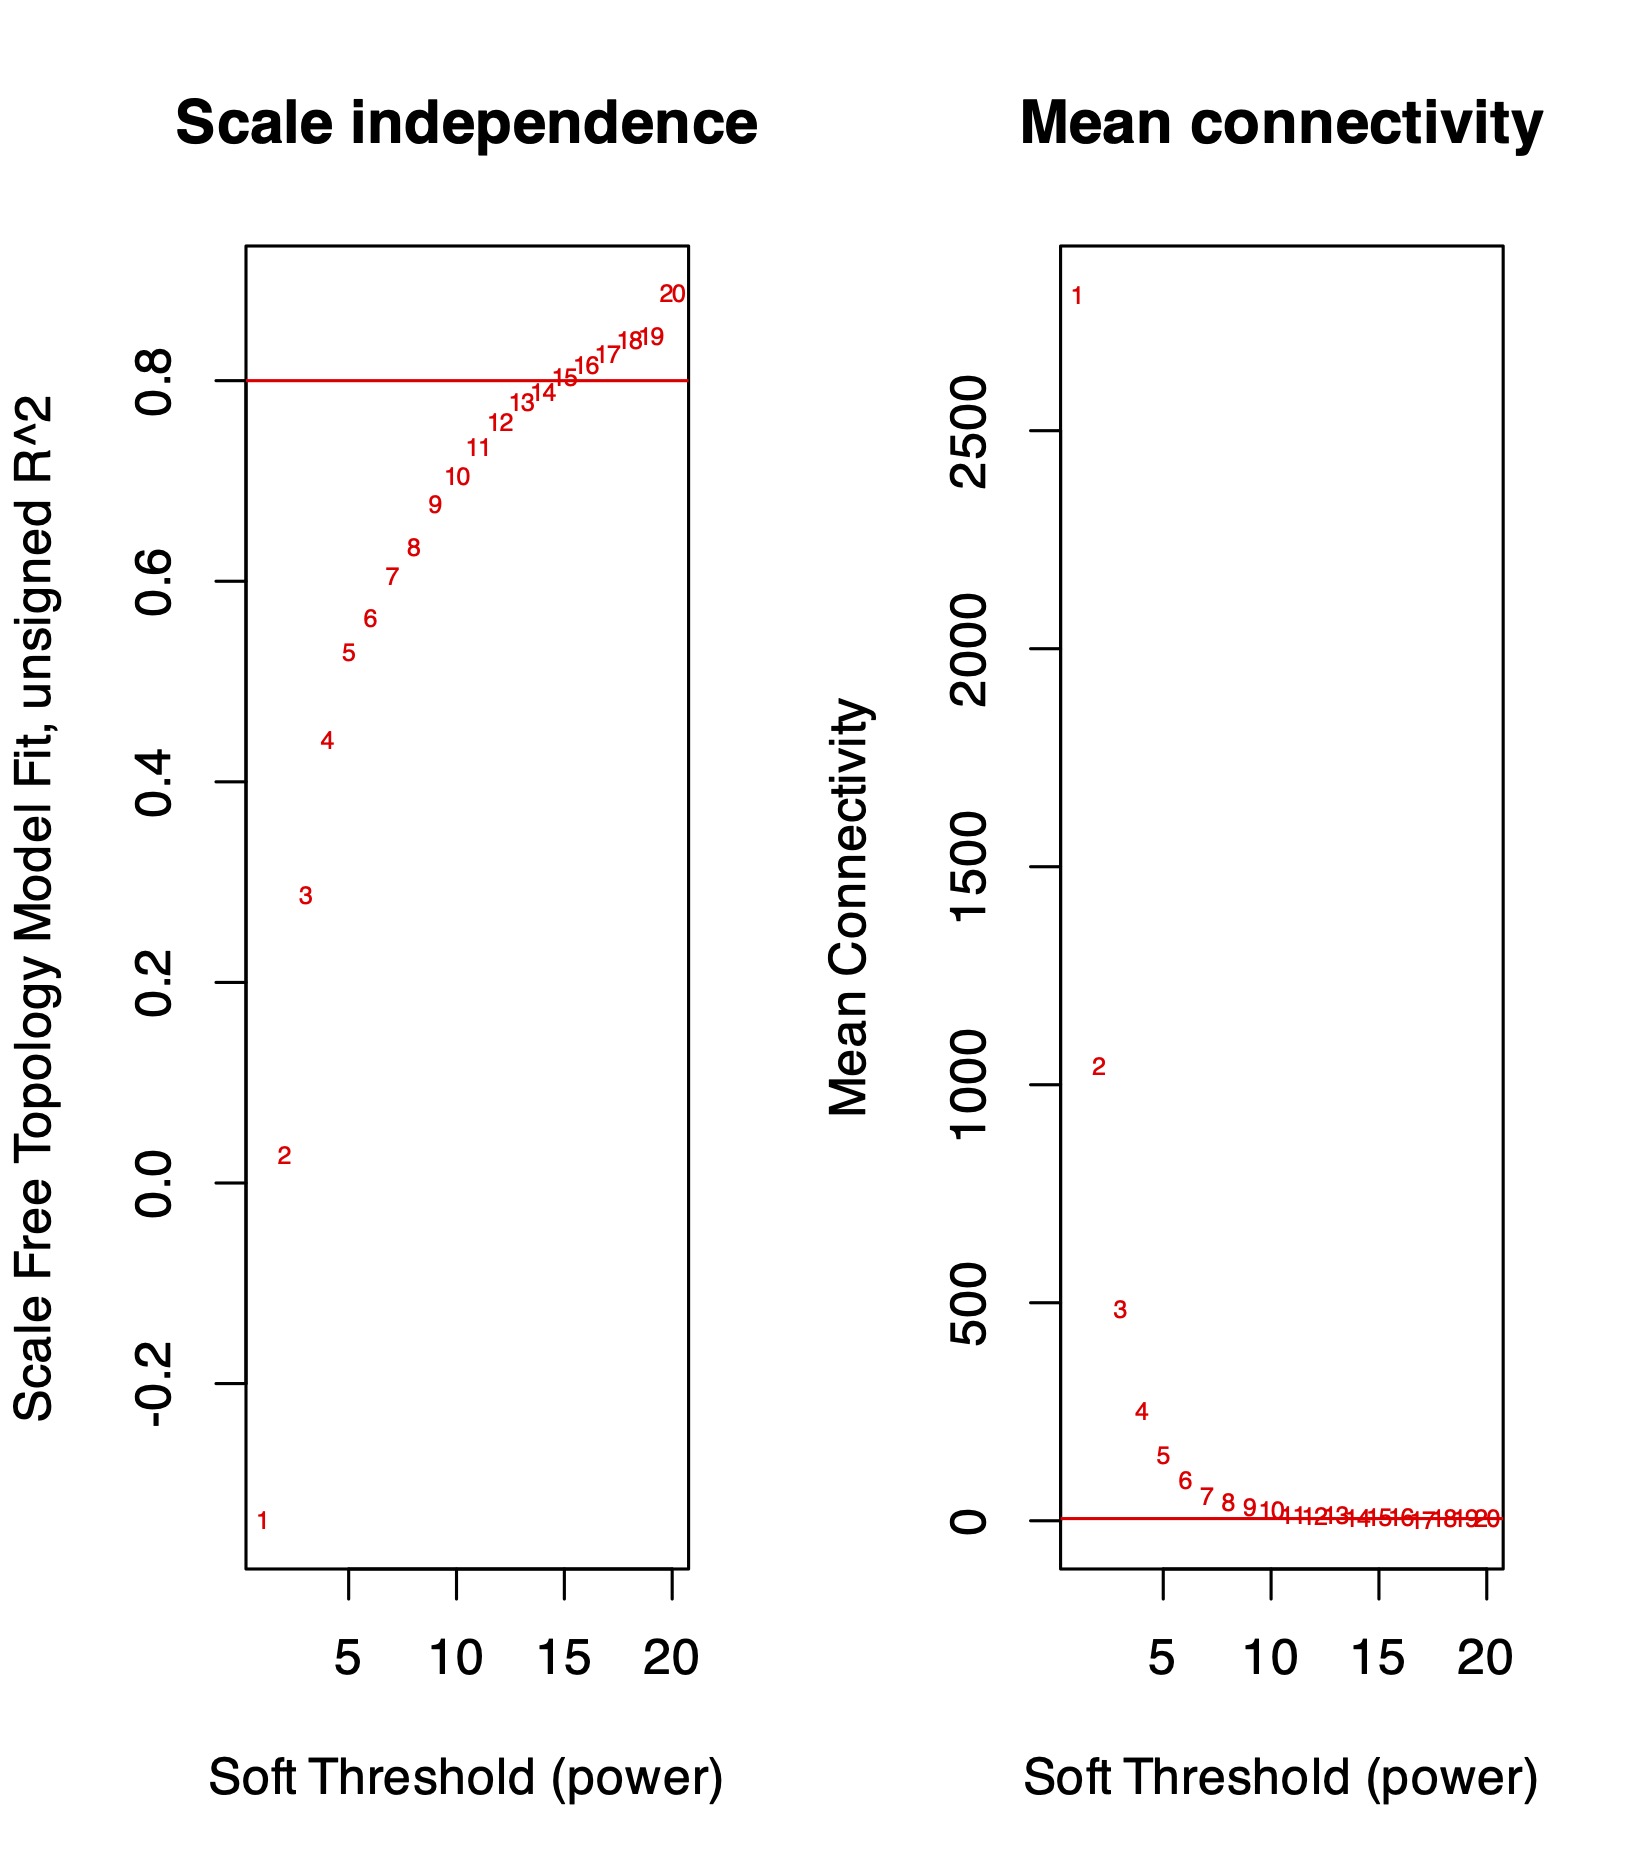
Scale independence and mean connectivity for different power transformations.
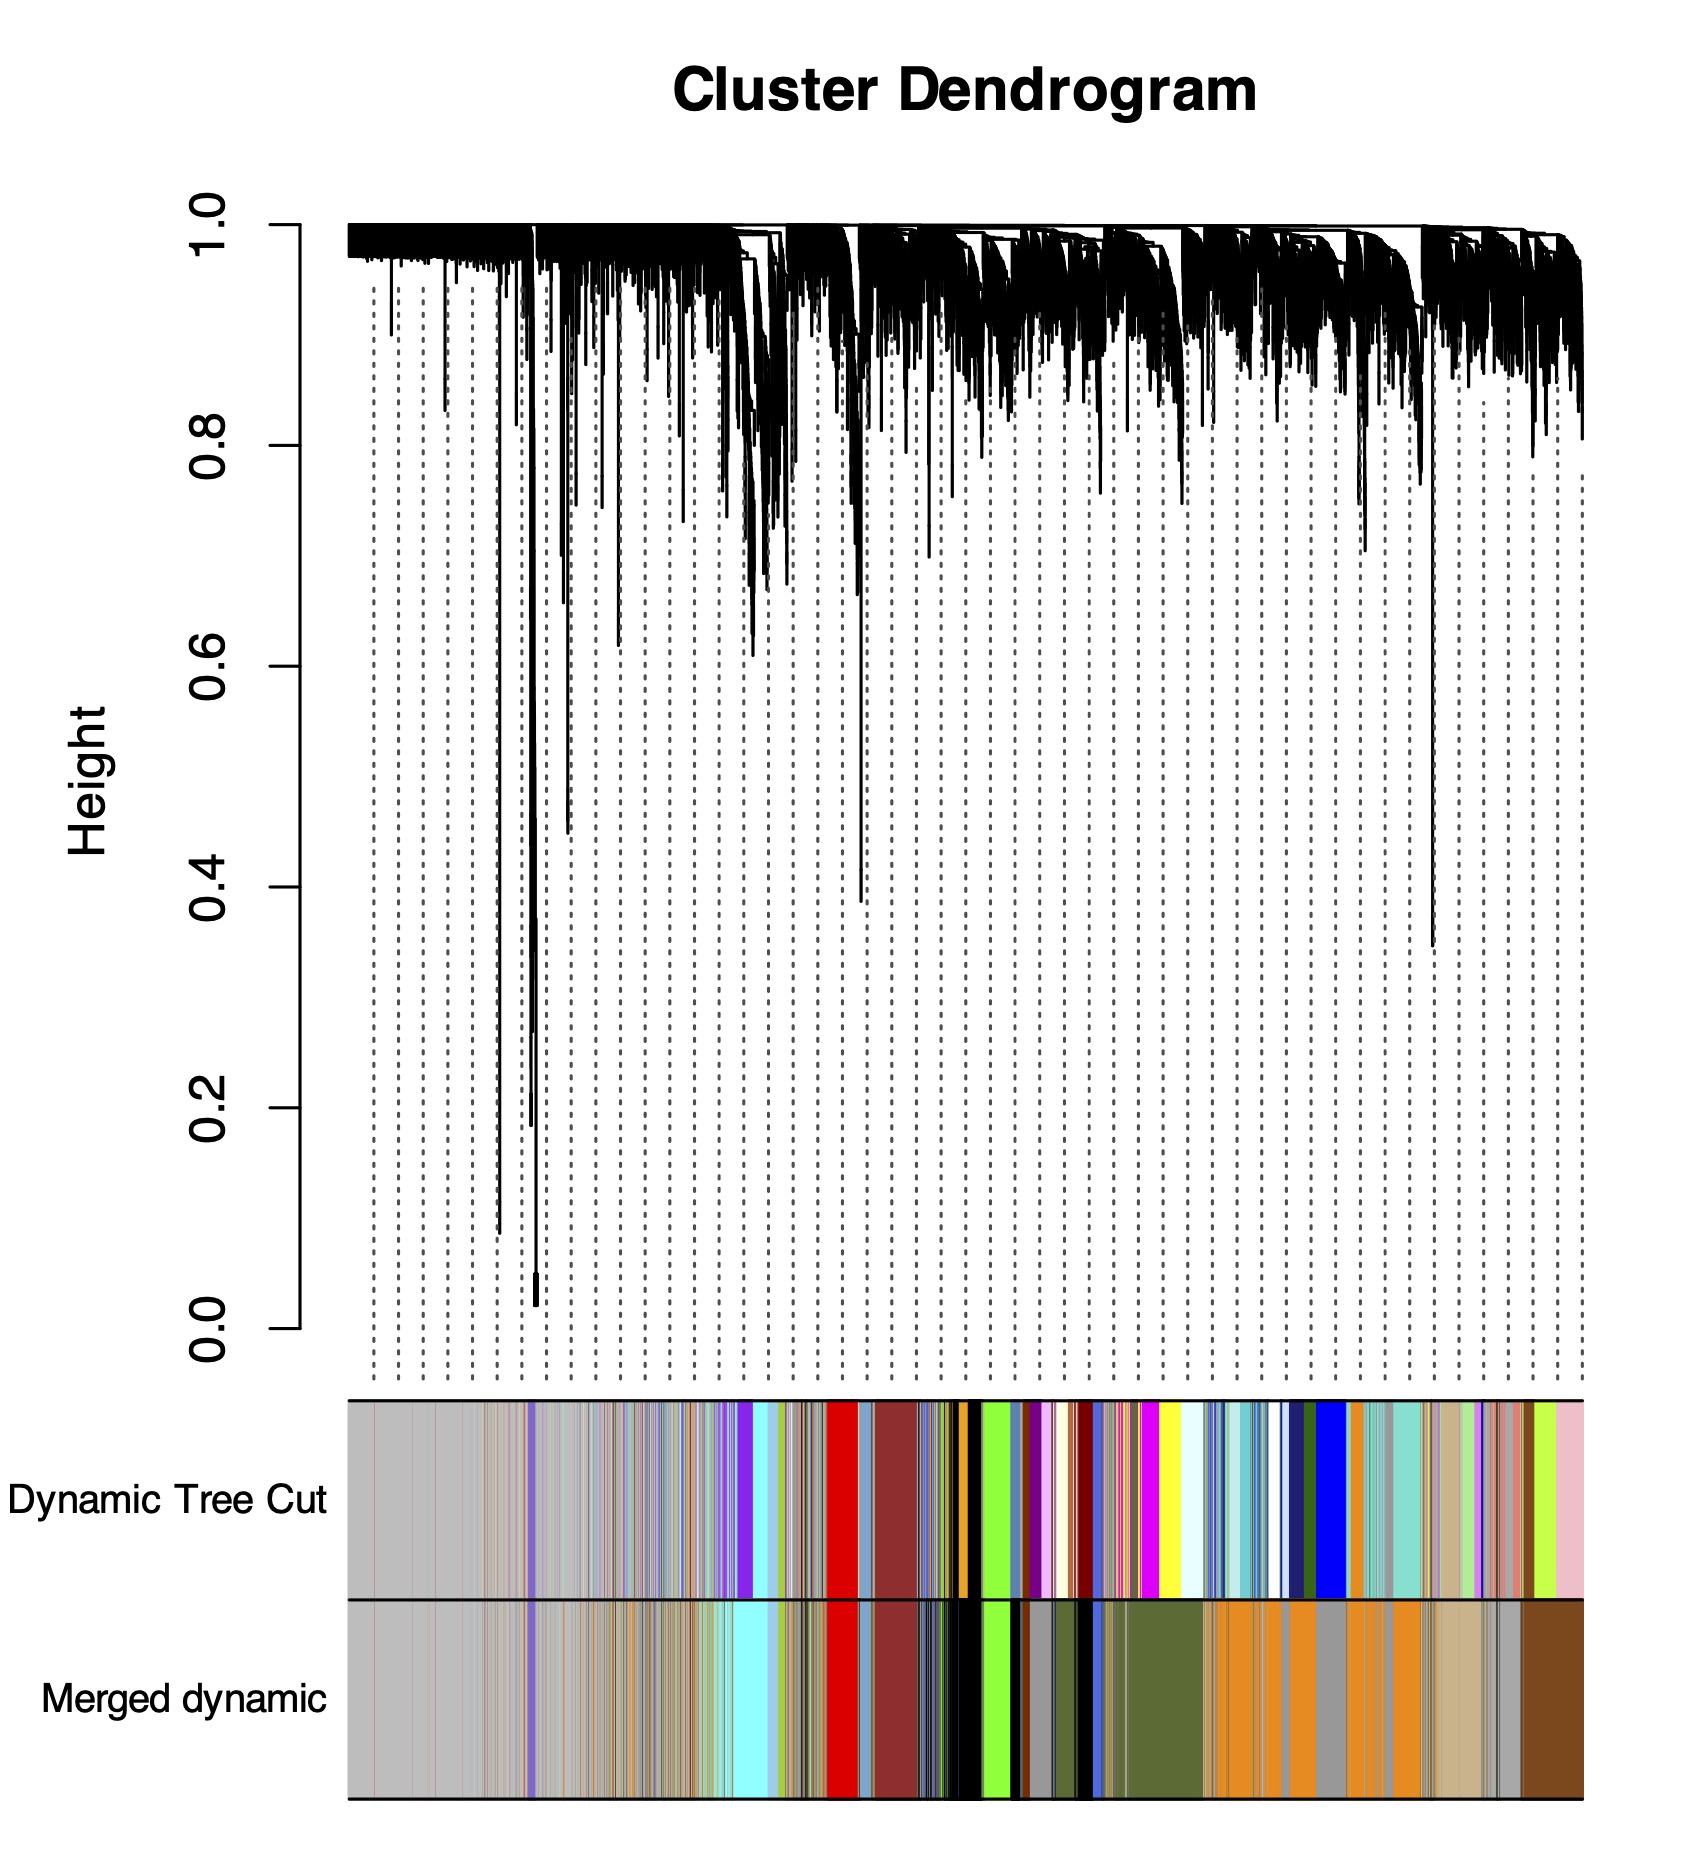
Cluster dendrogram.
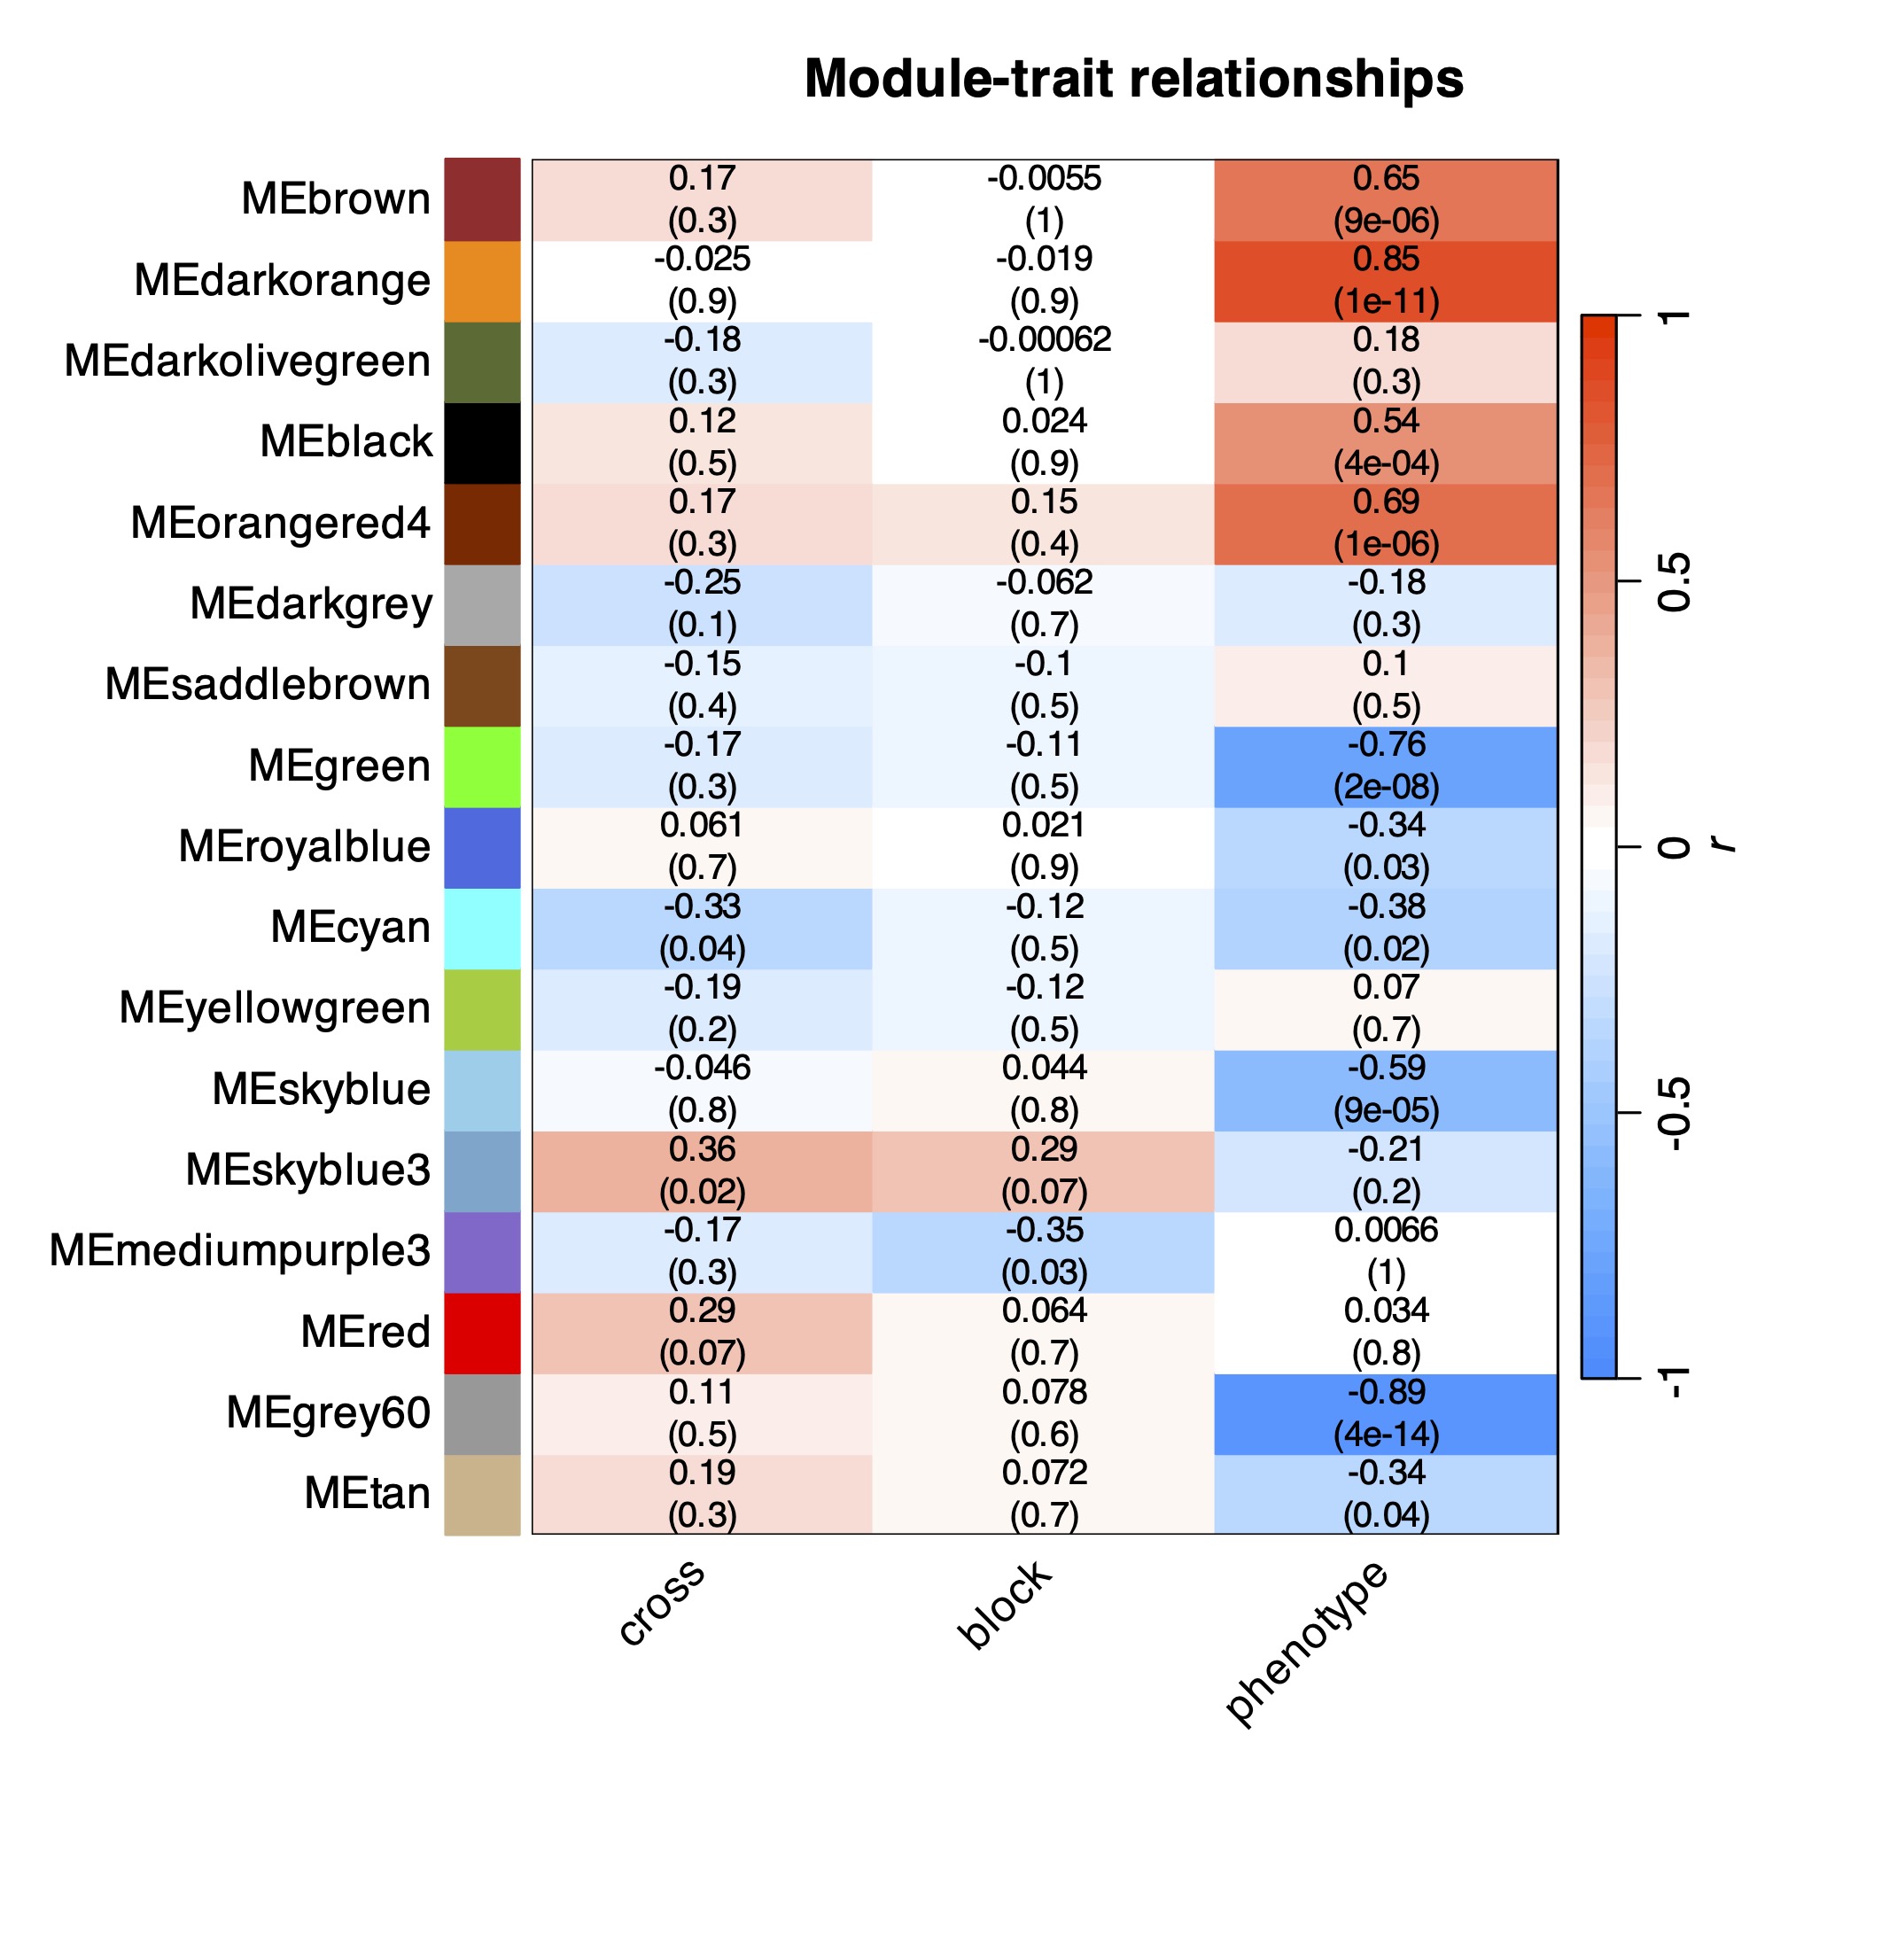
Module-trait relationships. In each cell, Pearson correlation coefficients and p-values are indicated.
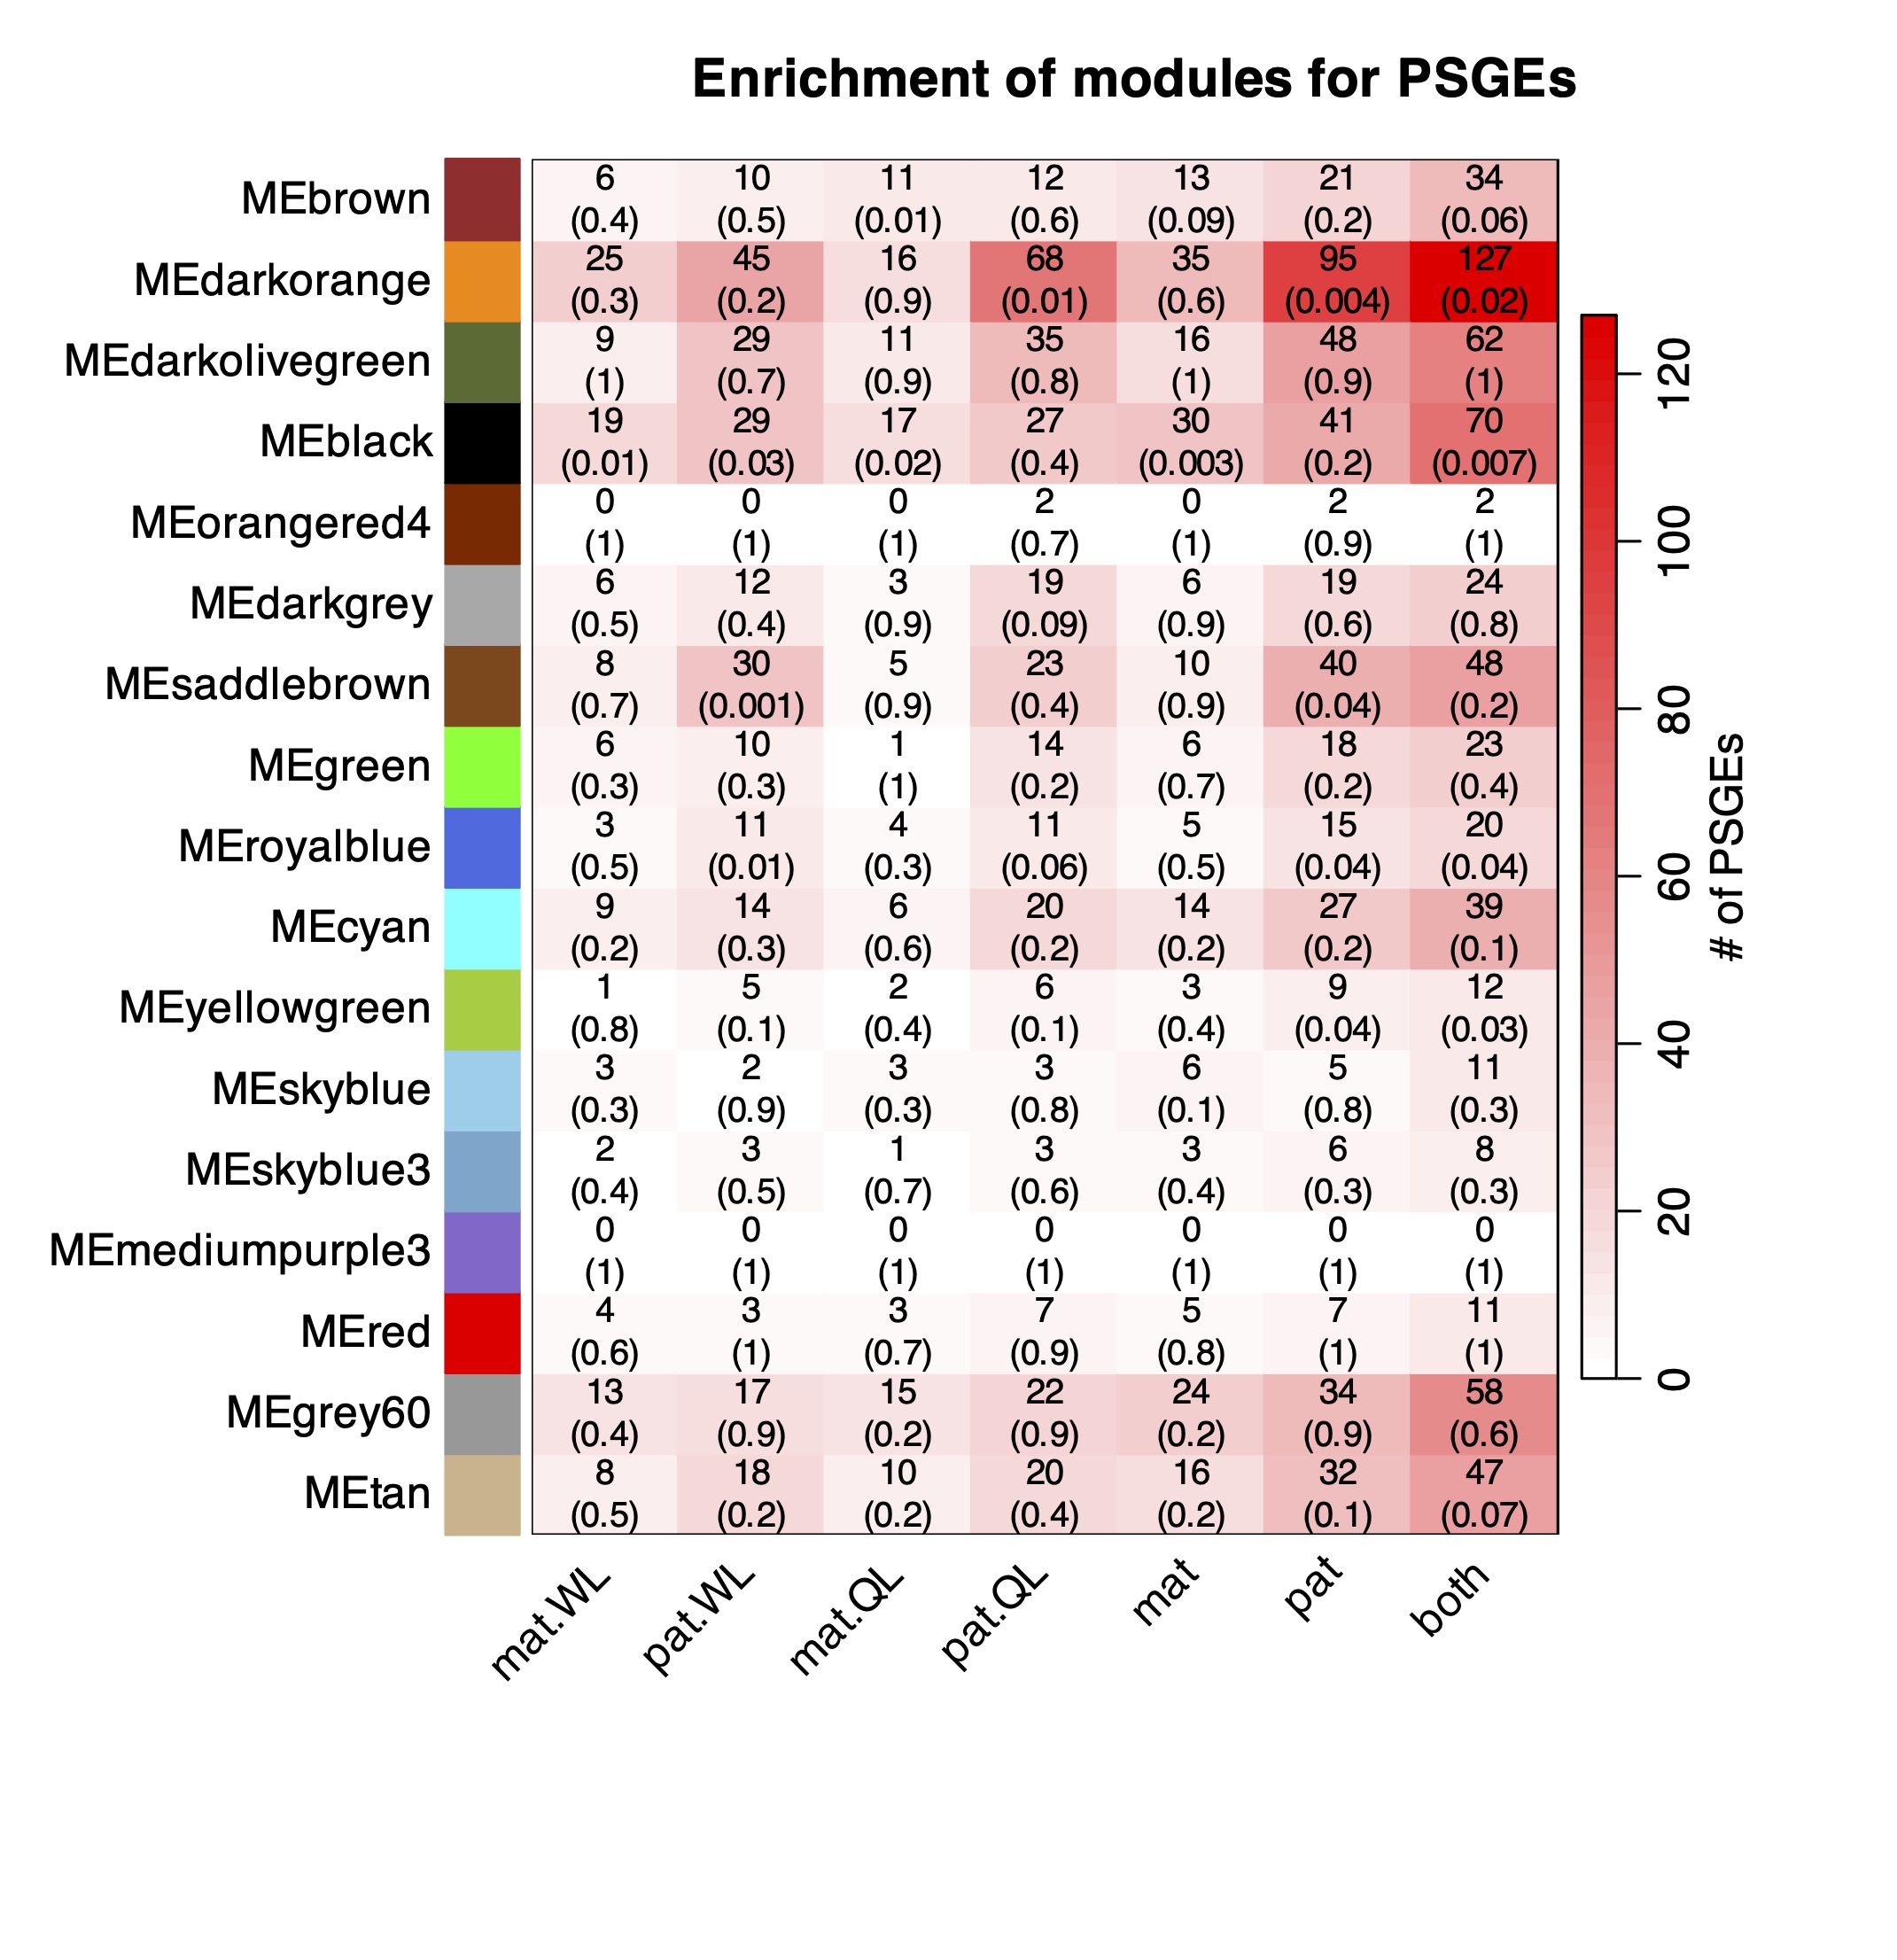
Module enrichment with POE genes. In each cell, the number of POE genes is indicated, followed by the Fisher’s exact test p-value of module enrichment with POE genes.