Metacleaner
Automated curation of barcode sequence databases for metabarcoding and metagenomics
DNA metabarcoding
Update 05/06/25 - Read this article on Substack
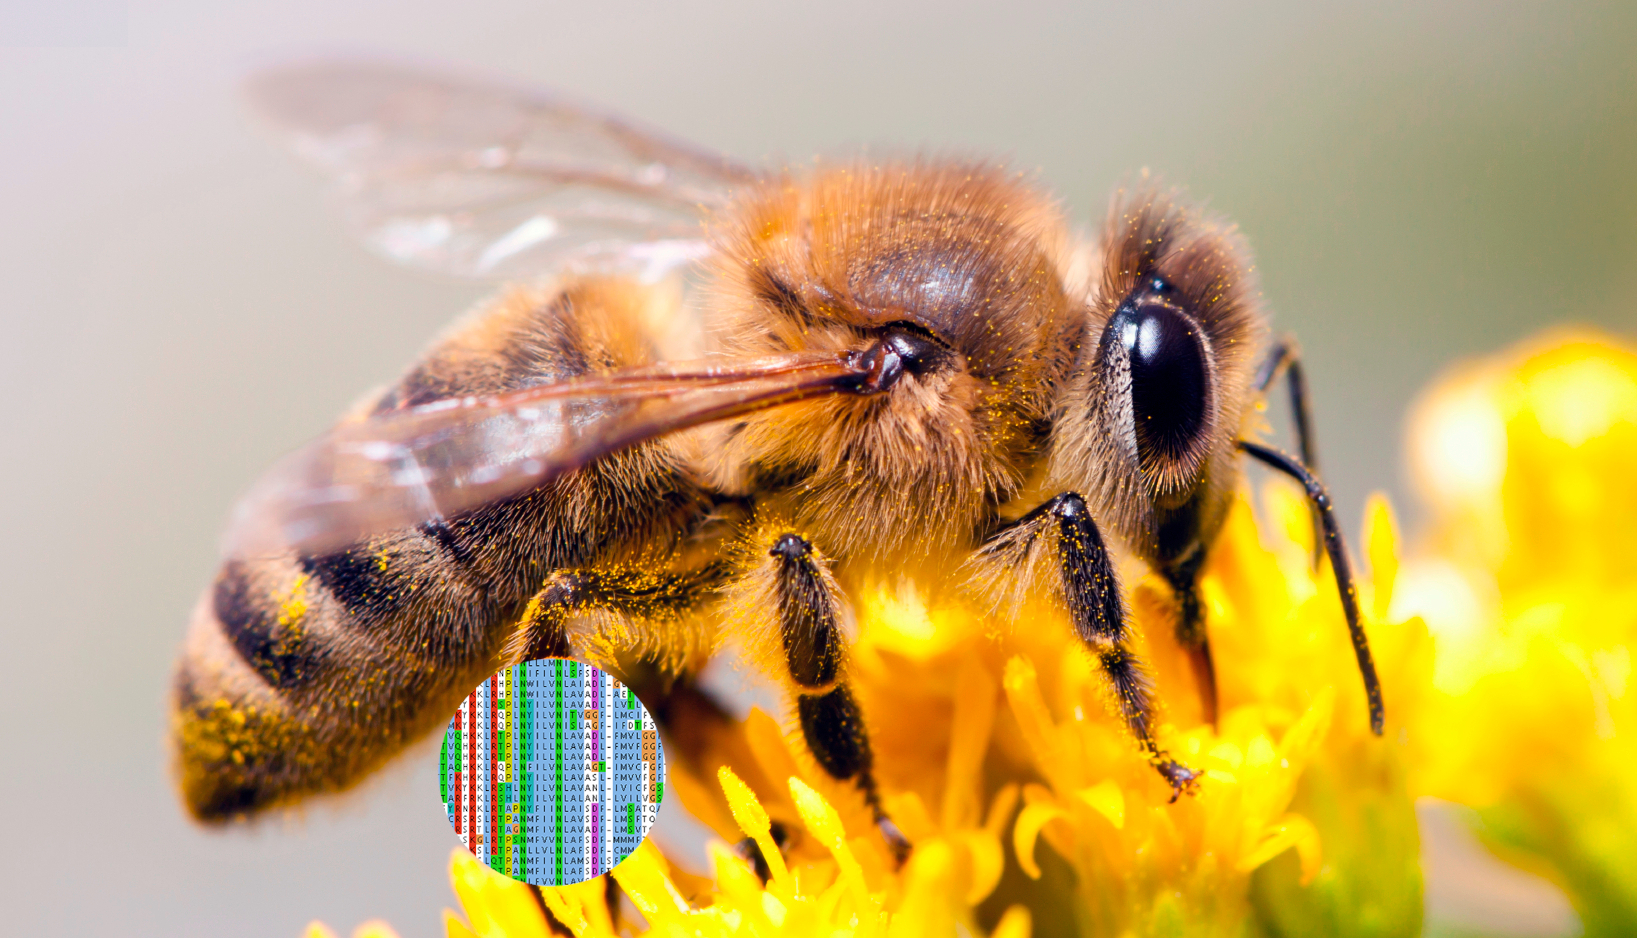
Say you’re managing honey bee colonies for the purpose of honey production, and you want to know what their product is made of. What sources of nectar are your bees foraging on? You could spend weeks following your bees around, taking note of which flowers they frequent. You might notice some common genera represented - like clover (Trifolium) or locust (Robinia). But, knowing that Apis mellifera is a generalist forager and you’ve got tens of thousands of bees per colony, you could never possibly collect as much data as they already are. So, how can you leverage that data? (Or, if you’re totally uninterested in the composition of honey, say you’re interested in what species of bacteria are colonizing your GI tract. Insert your own “I have an environmental sample and I want to know what’s in it” problem here.)
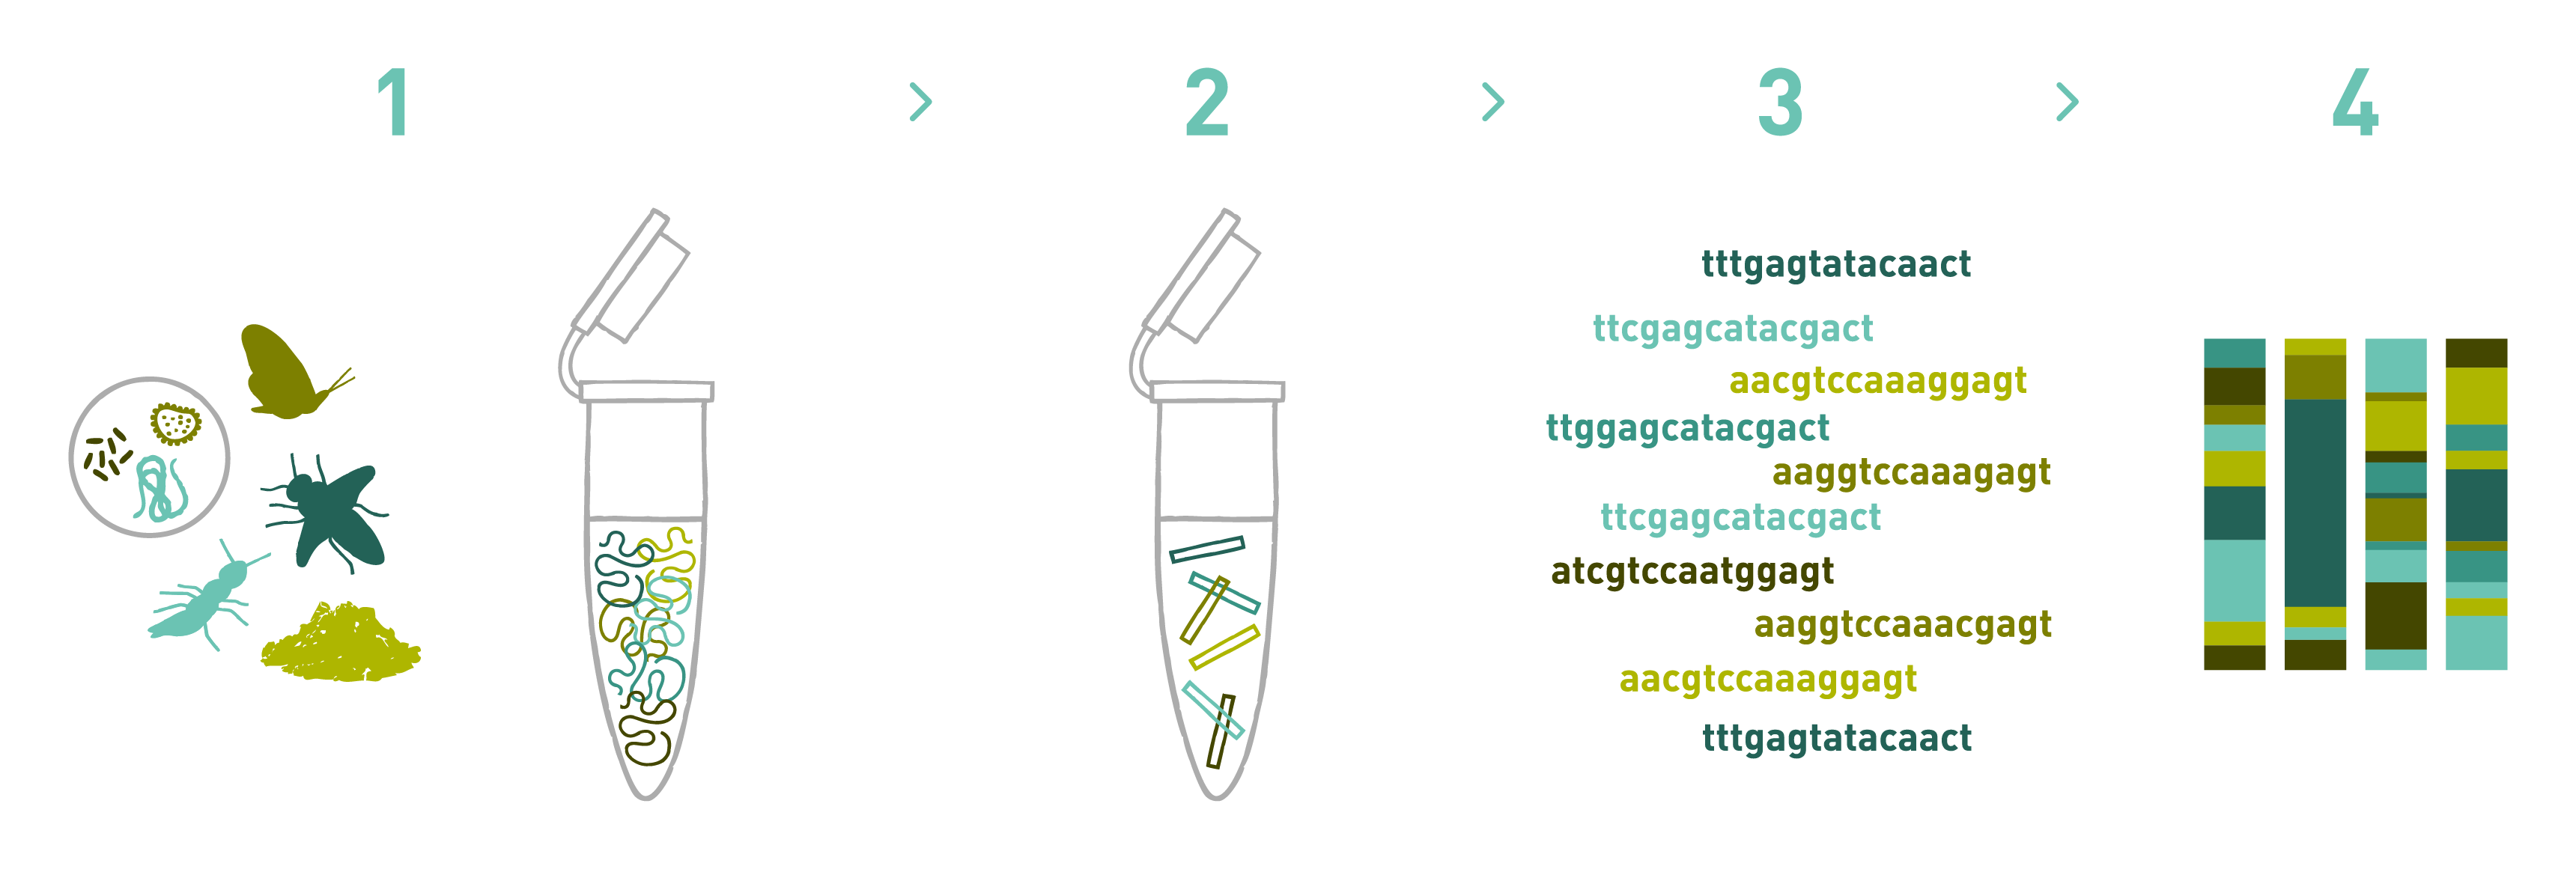
DNA metabarcoding is a method for assessing taxonomic composition within a sample by “barcoding” of DNA: matching up the sequences of DNA molecules in a sample with a reference sequence database. The process is straightforward: sample homogenization, DNA extraction, PCR amplification, sequencing, and data analysis.
Assumptions and problems
Like all scientific methods, the basis of metabarcoding rests on a few fundamental assumptions:
- 1) You’ve not contaminated your sample while handling it, and
- 2) The loci that you’re amplifying (and by extension, the barcode sequences in your reference database) are sufficiently different between taxa to assign short sequencing reads to taxa.
In this post, I want to address some problems that emerge from assumption #2, and propose some solutions. Throughout, I will use data generated through metabarcoding analysis of European honey bee Apis mellifera honey samples collected from Pennsylvania beekeepers, using barcode sequences extracted from the ITS1/ITS2 region for plant DNA barcoding. The reference sequence databases used here were constructed by retrieving all publicly available ITS1/ITS2 region sequences identified in plants within Magnoliopsida (the class of flowering plants that pollinator insects like the honey bee are mutualists with) which were accessible on NCBI as of 01-28-22, and using open-source software (MetaCurator) to automatically identify and extract the barcode marker region of interest from those sequences. See here for database construction and curation methods. In total, the databases are composed of 61,717 ITS1 barcodes representing 5,687 genera, with an average of 10.86 barcodes per genera (SD = 37.56), and 58,482 ITS2 barcodes representing 5,489 genera, with an average of 10.65 barcodes per genera (SD = 35.28).
Problem #1: mislabeled sequences
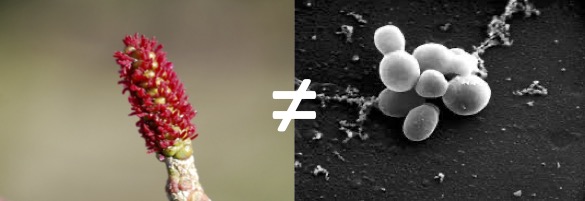
If your reference database is composed of sequences retrieved from open-access repositories like NCBI GenBank, you will unfortunately encounter many sequences that have been mislabeled. In some cases, these are sequences which GenBank staff could not verify as being of the taxa that the uploader identified them as being. For example, sequence accession FJ860092.1 is labeled as being from a sample of Chinese yam, Dioscorea polystachya - however, this sequence is 100% identical to sequence accession KX826865.1 from an “uncultured fungus” sample, which could also not be verified. In other cases, they have passed the verification process and are thus “valid” sequences. For example, sequence accession AJ251663.1 is labeled as being from a sample of an Italian alder, Alnus cordata - however, this sequence is 100% identical to sequence accession MW215901.1 again from an unculture fungus sample, possibly containing Malassezia restricta (which are commonly found on the skin surfaces of many animals, including humans). This is especially problematic for honey sample metabarcoding, as many genera of fungi inhabit flowers, honey bees, honey bee colonies, and thus, honey.
This problem and some solutions have already been discussed in detail:
- Phylogeny-aware identification and correction of taxonomically mislabeled sequences
- Using taxonomic consistency with semi-automated data pre-processing for high quality DNA barcodes
These methods use algorithms to try and identify mislabeled sequences and place them within their correct lineages. But, what if I don’t understand what an Evolutionary Placement Algorithm is? I have tens of thousands of barcodes, how can I possibly check through them all to be sure they have been correctly relabeled?
Most importantly, how pervasive is this problem, really? Using a popular metabarcoding bioinformatics pipeline for reference, where sequencing reads are assigned to a genus if $\geq$98% of the read’s sequence is shared with a barcode’s sequence (in terms of sequence identity and query coverage), I checked to see how many of the barcodes in my ITS1 & ITS2 databases matched non-plant (not within Embryophyta) sequences at these thresholds. I downloaded all publically-accessible non-plant ITS1/ITS2 region sequences from NCBI and used local BLASTn searches to identify matching barcodes. I excluded sequences from “uncultured eukaryotic clone” samples, as these are often sequences from dust samples which contain plant pollen (e.g., sequence accession KF800566.1 for which 98.33% of its sequence is 100% identical with sequences in several species of Willow (Salix). I found this problem affects roughly 1% of ITS1 barcodes and 6.1% of ITS2 barcodes. Why so many more for ITS2? Leave a comment below if you’ve got any insight.
What about valid plant sequences that are mislabeled as belonging to - or look very similar ($\geq$98%) to - different plants?
Problem #2: sequence conservation
Metabarcoding is limited by sequence evolution; the extent of this limitation increases as the length of the barcode region decreases. In extracting a specific barcode region of interest, irrelevant sequence is trimmed out, which limits the total space for any given sequencing read to align. This decreases our runtime, but also increases the likelihood that two barcode sequences will be identical. Depending on the pipeline, reads that align equally well to multiple barcodes may be randomly assigned and skew the taxonomic composition of your sample.
Okay, but, for what percentage of barcodes in my database is this really an issue? What is the potential false-positive rate in my analysis due to this problem? Using taxonomizr to retrieve taxonomy information for each accession in the database and their blast hits against all ITS1/ITS2 region sequences in Embryophyta, I conducted step-wise filtering of the barcodes to remove those which matched: sequences not within Magnoliopsida, sequences in multiple different genera, and sequences in only one but a different genus than the barcode’s accession was annotated as belonging to. Here is what I found:
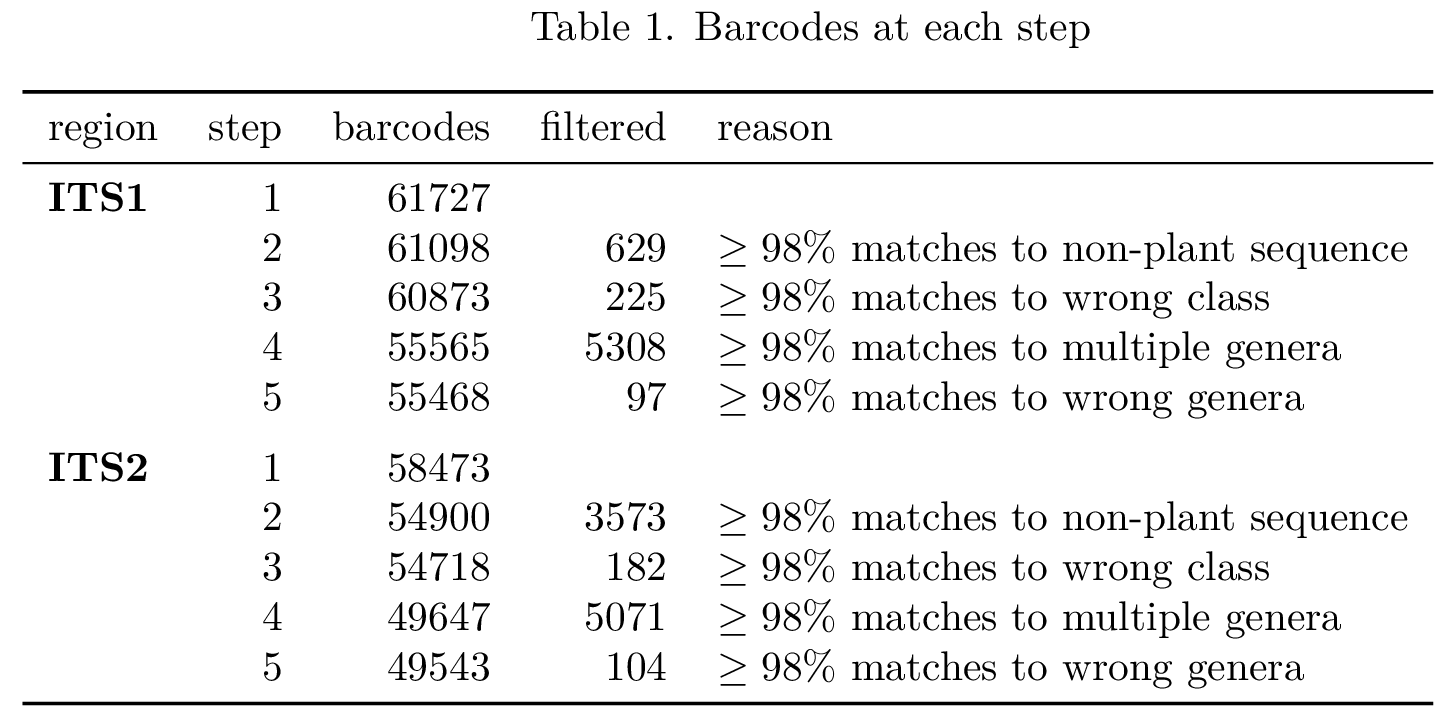
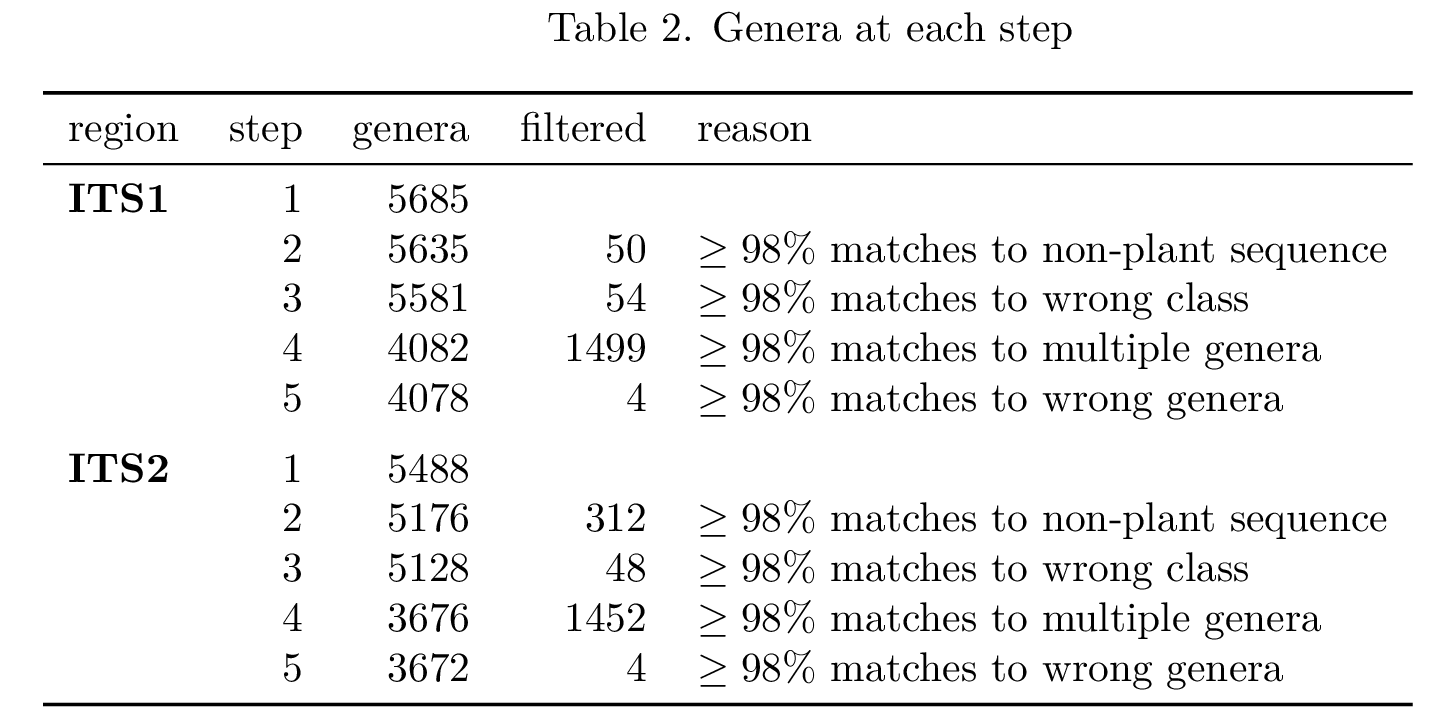
It is clear that there are, unfortunately, many barcodes in this database which will lead to inflated counts for many genera. For what percentage of the sequencing reads in my samples is this really an issue?
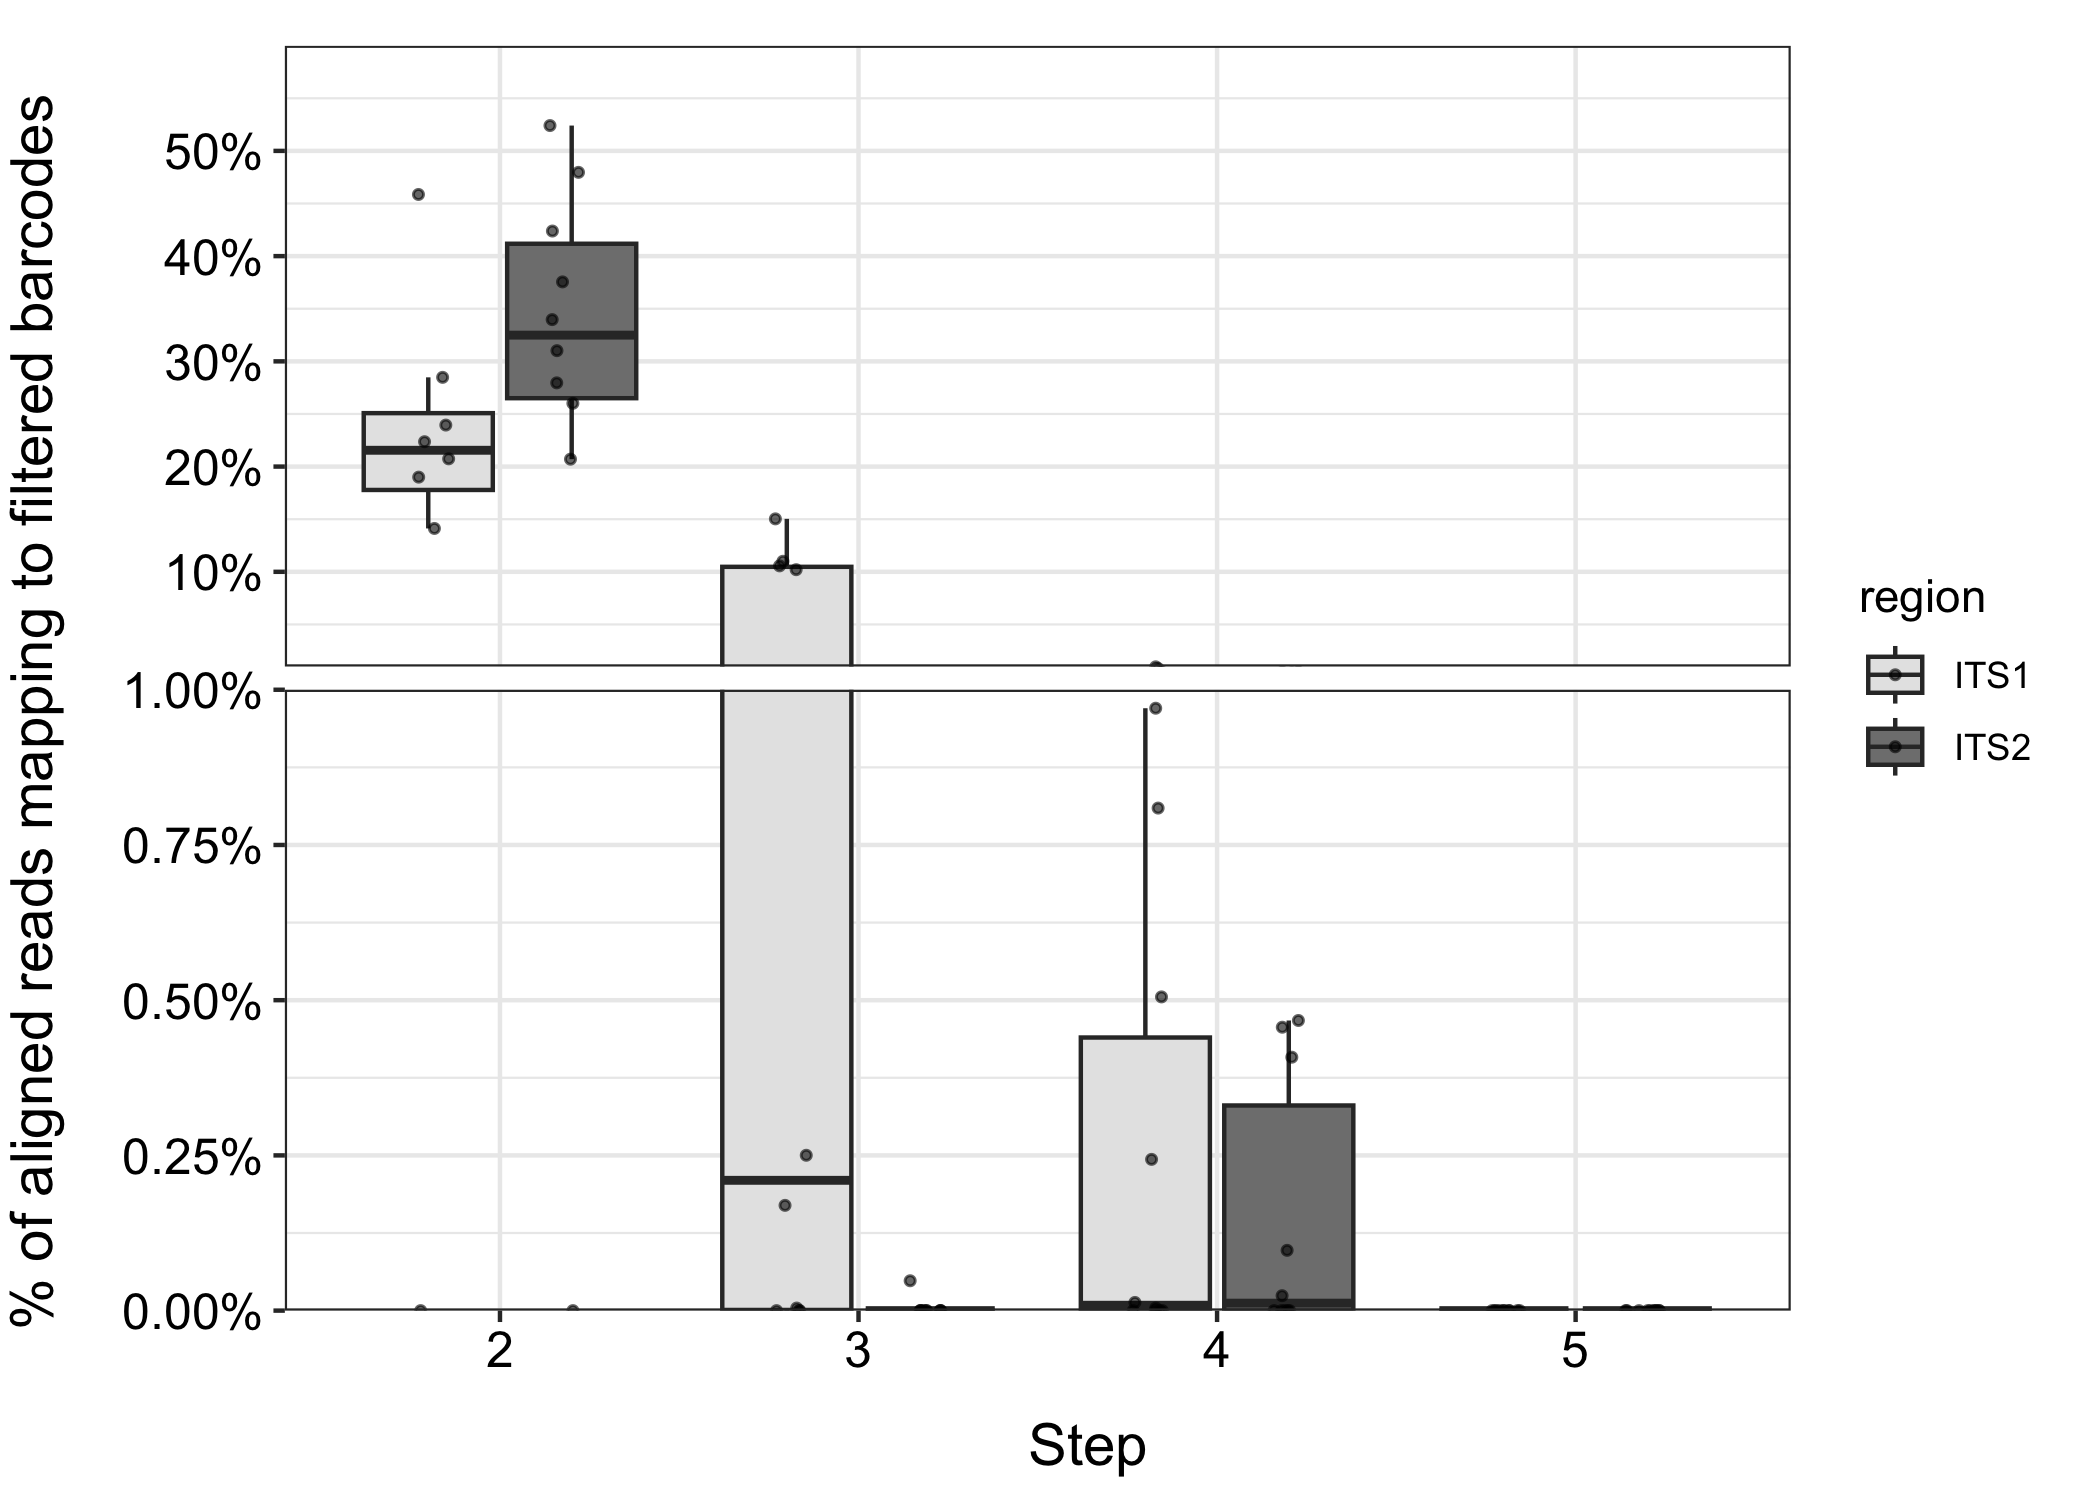 Figure 1. Reads from 10 honey samples matching ITS1 and ITS2 barcodes at each step in the filtering process. Step 2: barcodes that match non-plant sequences. Step 3: barcodes that match sequences in plants not within Magnoliopsida. Step 4: barcodes that match sequences in multiple genera. Step 5: barcodes that match sequences in the wrong genus.
Between 15-55% of the reads in these samples are mapping to barcodes that would be removed because they match non-plant (often fungal) sequences. Some of these reads may truly have originated from fungi, but they will also inflate counts for the genera that these barcodes were annotated as belonging to. Not great! Even after filtering these barcodes from the database, up to 1% of the reads in these samples are mapping to barcodes that do not differentiate genera. That’s a lot of false positives.
Solution: metacleaner - software for automated curation of barcode sequence databases for metabarcoding and metagenomics
Hopefully it is clear by now that these two problems are really the same - the fundamental problem - are the sequences in my database sufficiently different between taxa? A simple solution is to automate the process of searching for sequence conservation between our barcodes and sequences in other taxa, and filtering non-unique barcodes in a taxonomically-aware way. You can find my attempt at providing an open-source software solution for this problem under the software section of this website.
metacleaner takes as input a .fasta file of barcodes generated by tools like MetaCurator. The workflow is straightforward:
-
Barcodes are searched for hits against known undesired (in this example, non-plant) sequences using blastn. Barcodes with hits above user-defined thresholds for percentage identity and query coverage are flagged as mislabeled.
-
Barcodes are then searched for hits against known desired (in this example, all of Embryophyta) sequences using blastn. Barcodes with no hits above user-defined thresholds for percentage identity and query coverage are flagged as potentially mislabeled, while hits above these thresholds are flagged as candidate barcodes.
-
Taxonomy info for the top hits against desired sequences for both the candidate barcodes and potentially mislabeled barcodes are retrieved using taxonomizr and compared against the taxonomy info of the query barcode. If the taxonomy info of the query and subject (including cases where there are multiple hits) are not similar at a user-defined level of taxonomy (one of superkingdom, phylum, class, order, family, genus, or species), the query barcode is flagged as mislabeled. An additional inclusion filter can be set; all hits at the percentage identity and query coverage thresholds must have this information (e.g., must be within Magnoliopsida) or the query barcode will be flagged as mislabeled.
-
Finally, mislabeled barcodes are filtered from the database.
How does this impact the read alignments?
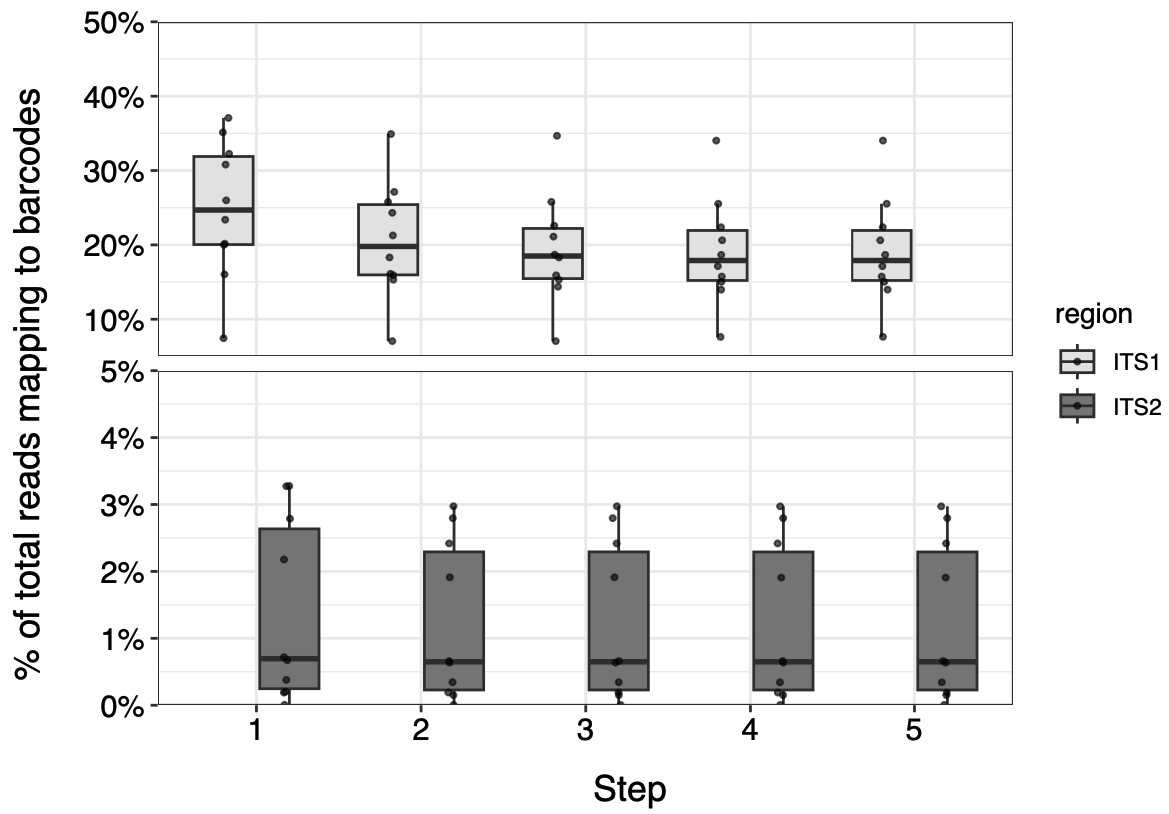 Figure 2. Reads from 10 honey samples matching ITS1 and ITS2 barcodes at each step in the filtering process.
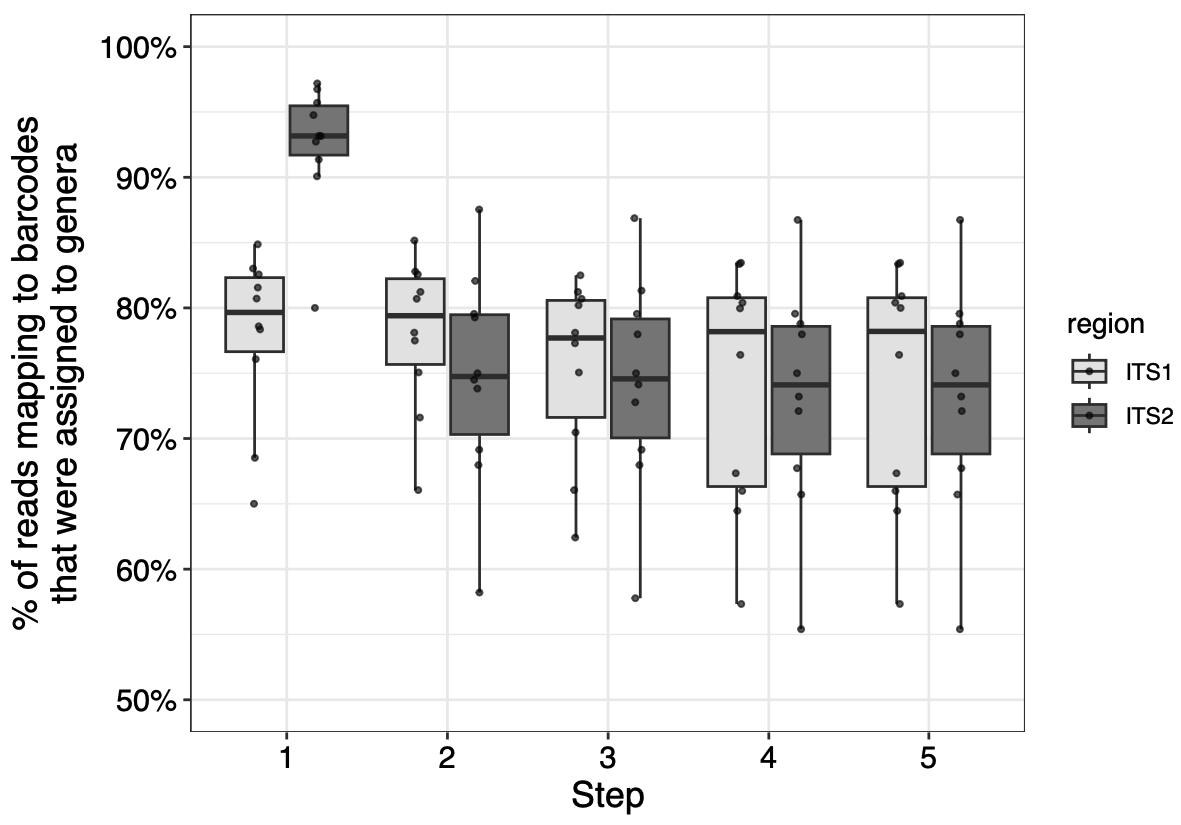 Figure 3. Genera of reads from 10 honey samples matching ITS1 and ITS2 barcodes at each step in the filtering process.
In these samples, this conservative barcode filtering process ultimately does not noticeably reduce the number of usable reads, especially for ITS2. How do the original and filtered databases compare in a metabarcoding analysis?
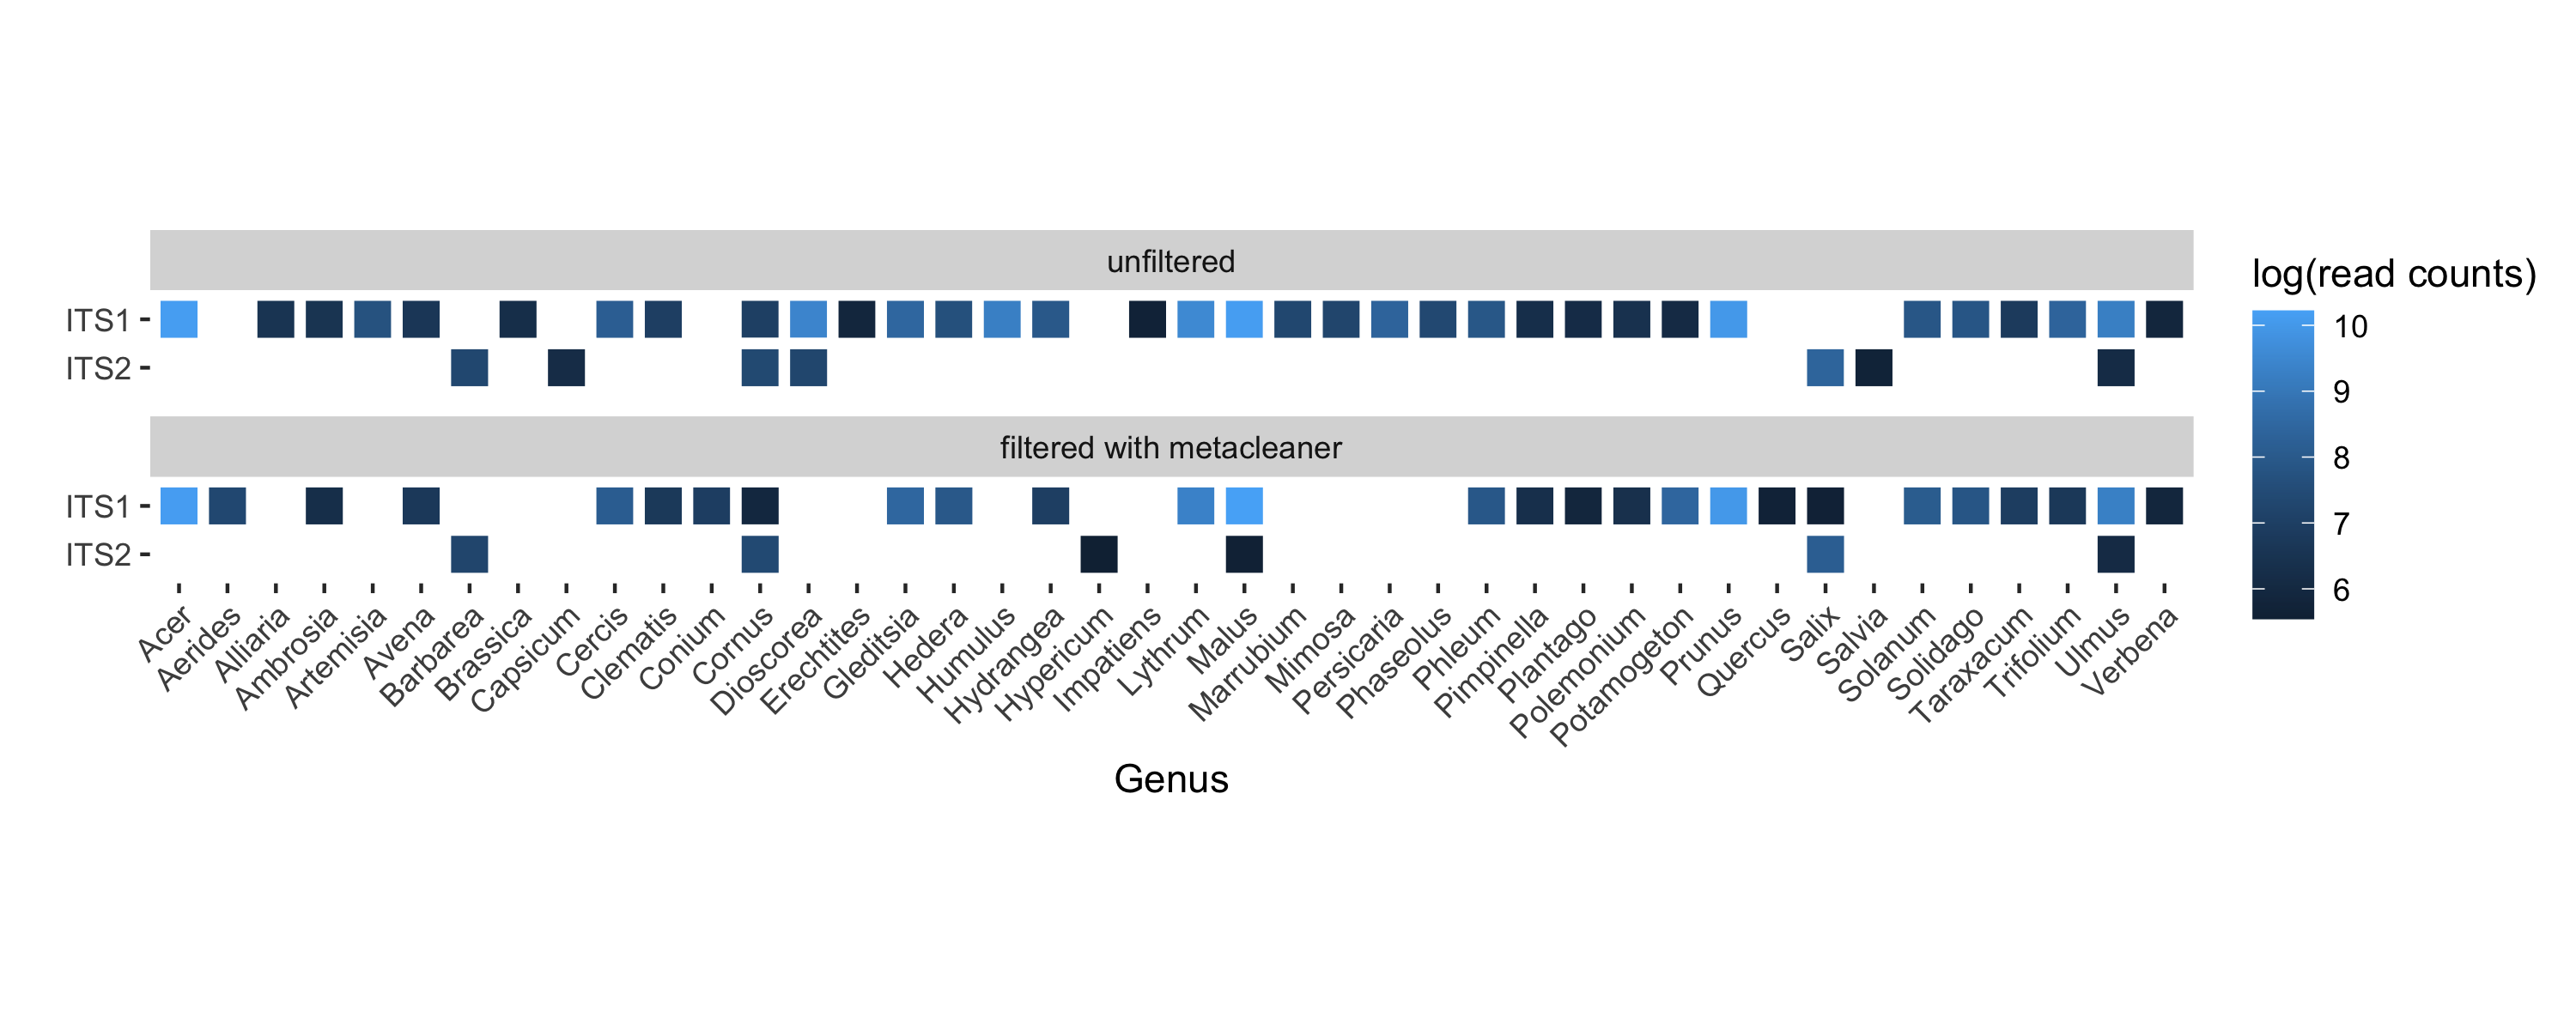 Figure 4. Reads assigned to genera represented in 10 honey samples collected from apiaries in Pennsylvania, USA
(click to enlarge).
Notable additions after filtering: orchids (Aerides), hemlock (Conium), St. John’s wort (Hypericum), apple (Malus), oak (Quercus), and willow (Salix), which we know honey bees frequent in Pennsylvania. A notable loss: Dioscorea, the majority of which are tropical.
Caveat and conclusion
The obvious limitation of this approach is that it is highly conservative and will lead to possible reductions in taxonomic diversity represented in your metabarcoding analyses. Increasing the thresholds required for filtering will increase the number of genera represented in your database, but may increase the false-positive rate. Whatever percentage identity your bioinformatics pipeline requires to assign sequencing reads to genera should be at least the same threshold you require barcodes to differentiate genera. Otherwise, you are randomly assigning reads and inflating counts for some genera, which may dramatically skew the proportion of those genera represented in your samples.
Hopefully this resource addresses this problem and is useful to the metabarcoding community. Please leave comments and suggestions below or on the github repo.
References
Rulik, B. et al. (2017). Using taxonomic consistency with semi-automated data pre-processing for high quality DNA barcodes. Methods in Ecology and Evolution 8: 1878-1887. https://doi.org/10.1111/2041-210X.12824
Kolter, A., Gemeinholzer, B. (2021). Internal transcribed spacer primer evaluation for vascular plant metabarcoding. Metabarcoding and Metagenomics 5: 133-152. https://doi.org/10.3897/mbmg.5.68155.
Kozlov, A. M., Zhang, J., Yilmaz, P., Glöckner, F. O., Stamatakis, A. (2016). Phylogeny-aware identification and correction of taxonomically mislabeled sequences. Nucleic Acids Research 44(11): 5022-5033. https://doi.org/10.1093/nar/gkw396.
Richardson, R. T., Sponsler, D. B., McMinn-Sauder, H., Johnson, R. M. (2020). MetaCurator: A hidden Markov model-based toolkit for extracting and curating sequences from taxonomically-informnative genetic markers. Methods in Ecology and Evolution 11: 181-186. https://doi.org/10.1111/2041-210X.13314.
Rodríguez-Andrade, E., Stchigel, A. M., Terrab, A., Guarro, J., Cano-Lira, J. F. (2019). Diversity of xerotolerant and xerophilic fungi in honey. IMA Fungus 10: 20. https://doi.org/10.1186/s43008-019-0021-7.