
Bar chart of Type I error rates
Examples
t1e <- sweep_null_by_conf(0.8, n_iter = 2, n_samples = 100,
  n_features = 5)
plot_type1_error(t1e)
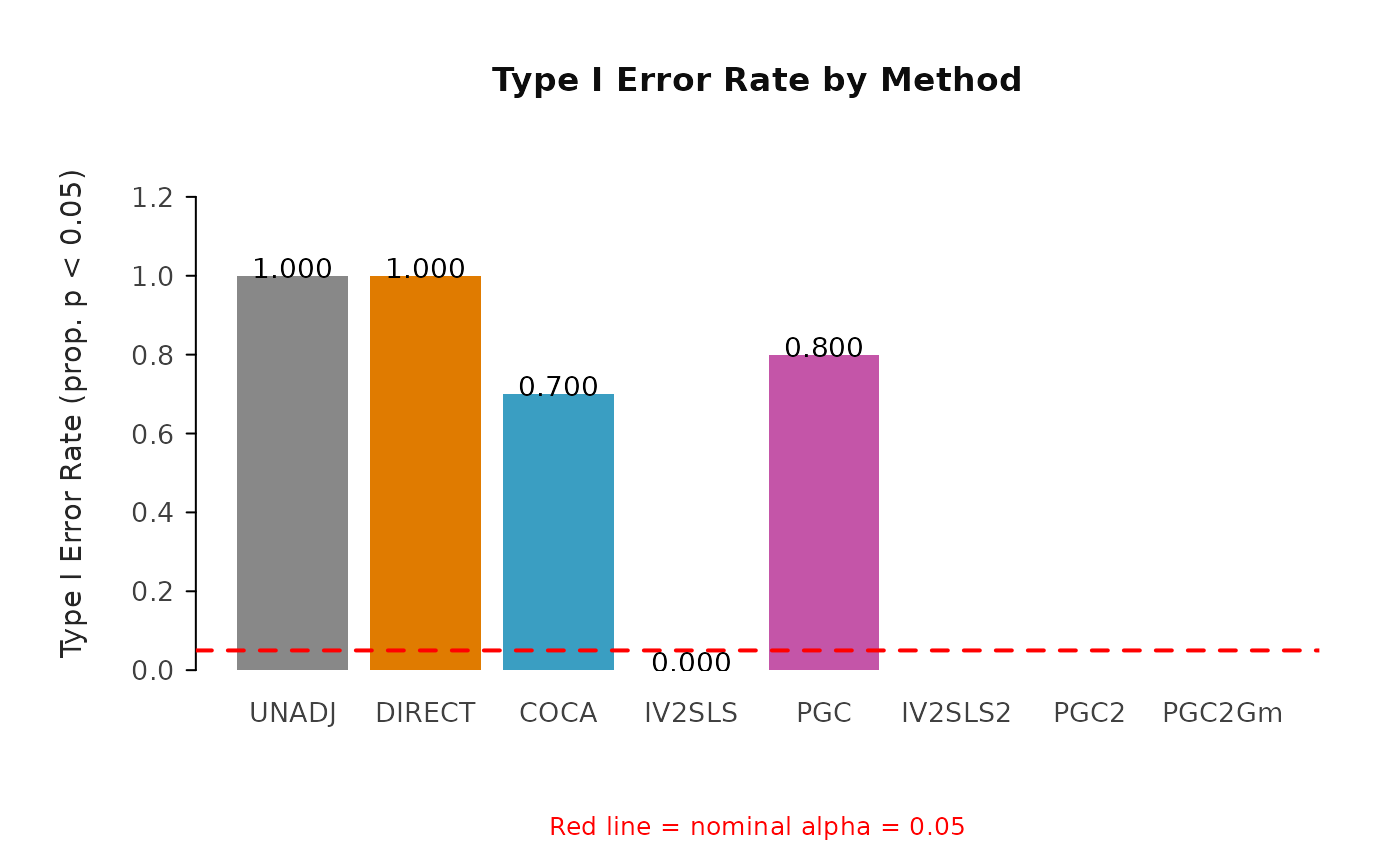
Bar chart of Type I error rates
t1e <- sweep_null_by_conf(0.8, n_iter = 2, n_samples = 100,
n_features = 5)
plot_type1_error(t1e)