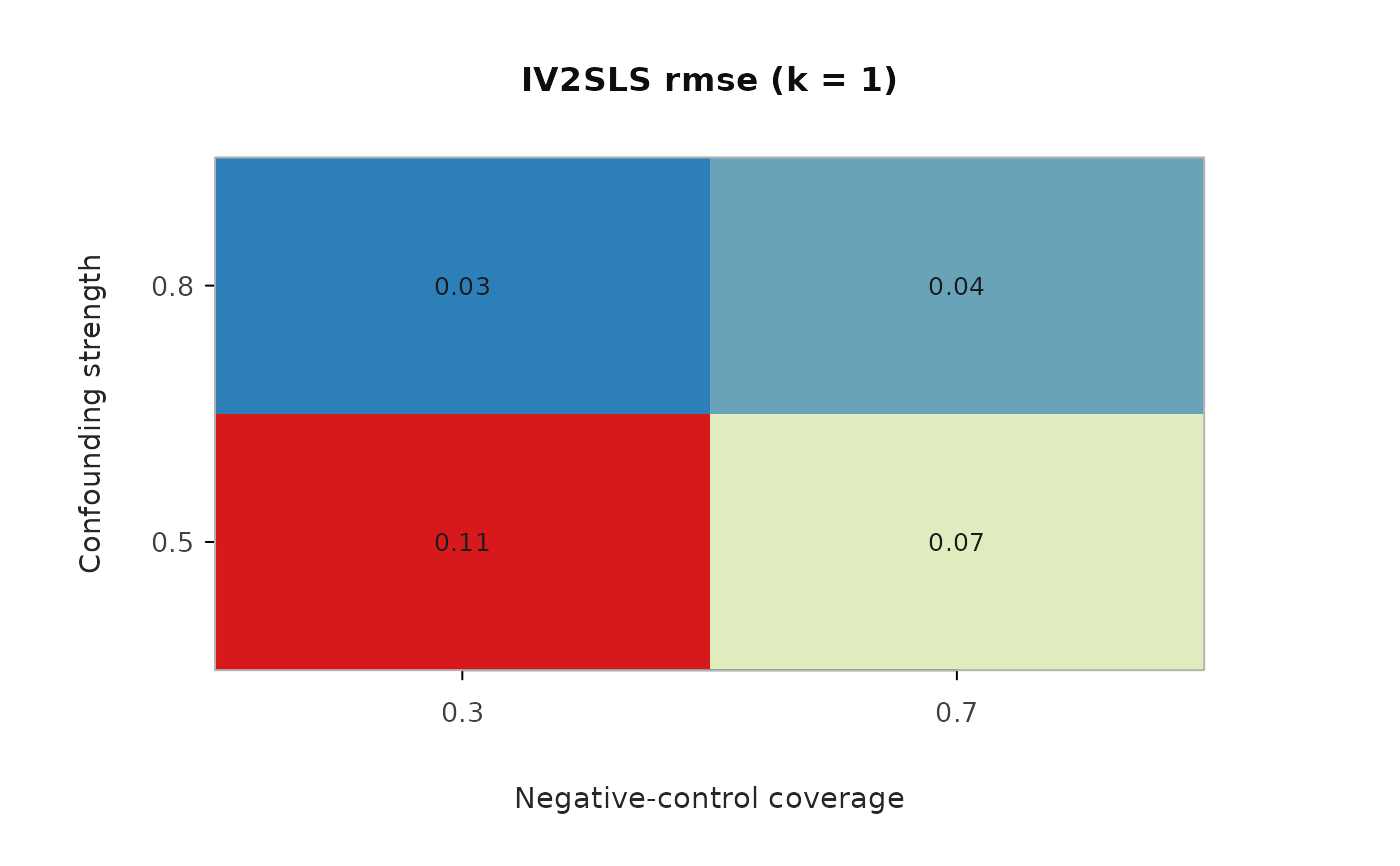
Heatmap of a sensitivity metric across the scenario grid
Source:R/plots.R
plot_sensitivity_heatmap.RdDraws a coverage x confounding-strength heatmap of a chosen metric for one estimator, at a fixed number of confounders. Useful for reading off where a method's bias/RMSE blows up.
Arguments
- sens
Object returned by
gan_sensitivity().- metric
Column of
sens$summaryto map (e.g. "rmse", "abs_bias", "power"). Default "rmse".- method
Estimator to display. Default "IV2SLS".
- k
Number of confounders to slice on. Default: first in the grid.
- title
Optional plot title.
Examples
sens <- gan_sensitivity(NULL, conf_grid = c(0.5, 0.8),
  coverage_grid = c(0.3, 0.7), n_iter = 2, n_samples = 100,
  n_features = 5)
plot_sensitivity_heatmap(sens)