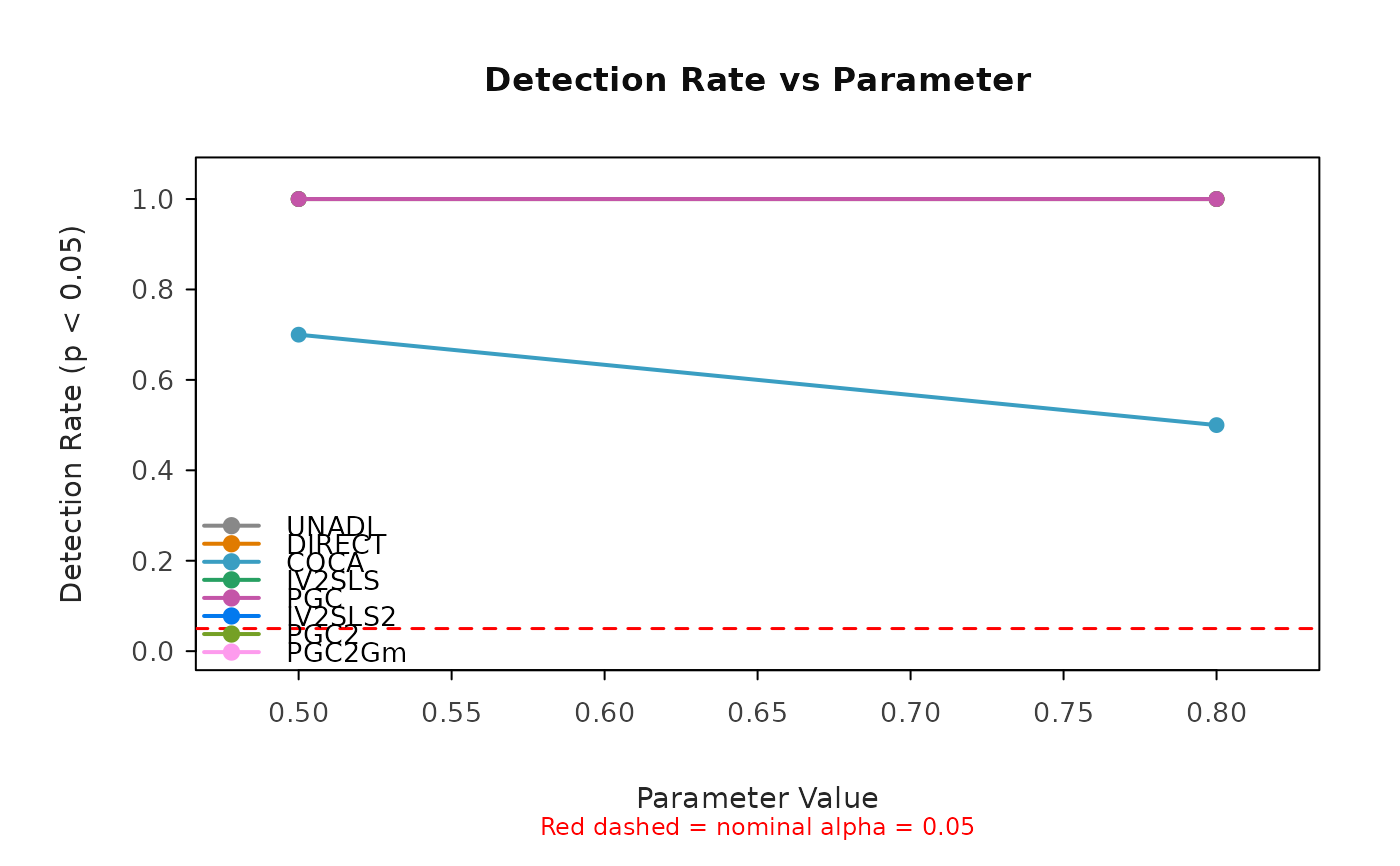
Plot detection rate (power) vs a swept parameter
Usage
plot_power(
  sweep_df,
  param_label = "Parameter Value",
  methods = iconic_method_order,
  title = "Detection Rate vs Parameter",
  legend_pos = "bottomleft"
)Examples
sweep <- sweep_param("conf_str", c(0.5, 0.8), n_iter = 2,
  n_samples = 100, n_features = 5)
plot_power(sweep$summary)