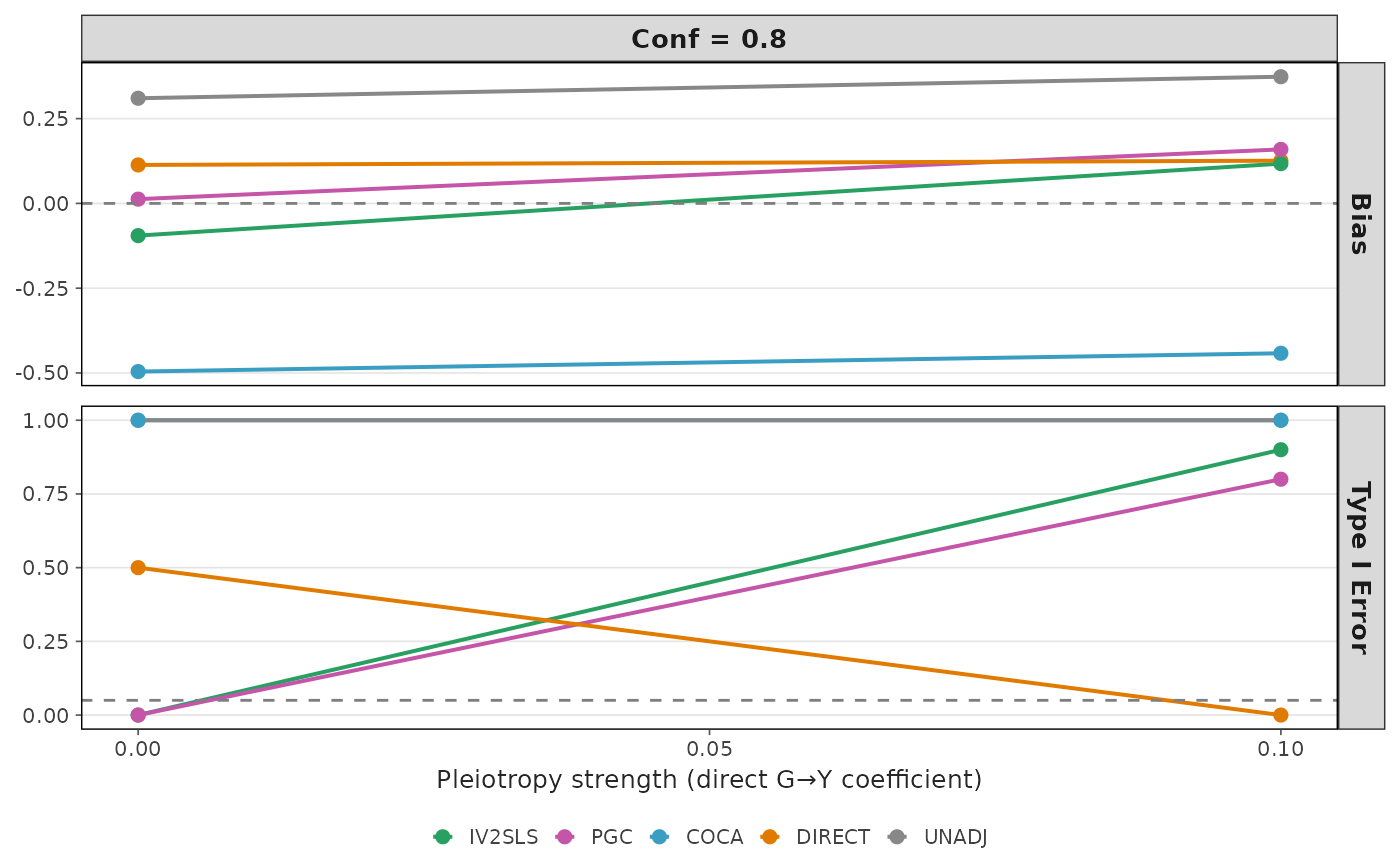
Produces a faceted figure showing estimator bias and Type I error under horizontal pleiotropy, across three confounding strengths.
Arguments
- sensitivity
Result of
gan_pleiotropy_sensitivity().- file
Optional file path to save the figure.
- width
Figure width in inches.
- height
Figure height in inches.
Examples
sens <- gan_pleiotropy_sensitivity(NULL, pleio_grid = c(0, 0.1),
  conf_grid = 0.8, n_iter = 2, n_samples = 100, n_features = 5)
plot_pleiotropy_sweep(sens)