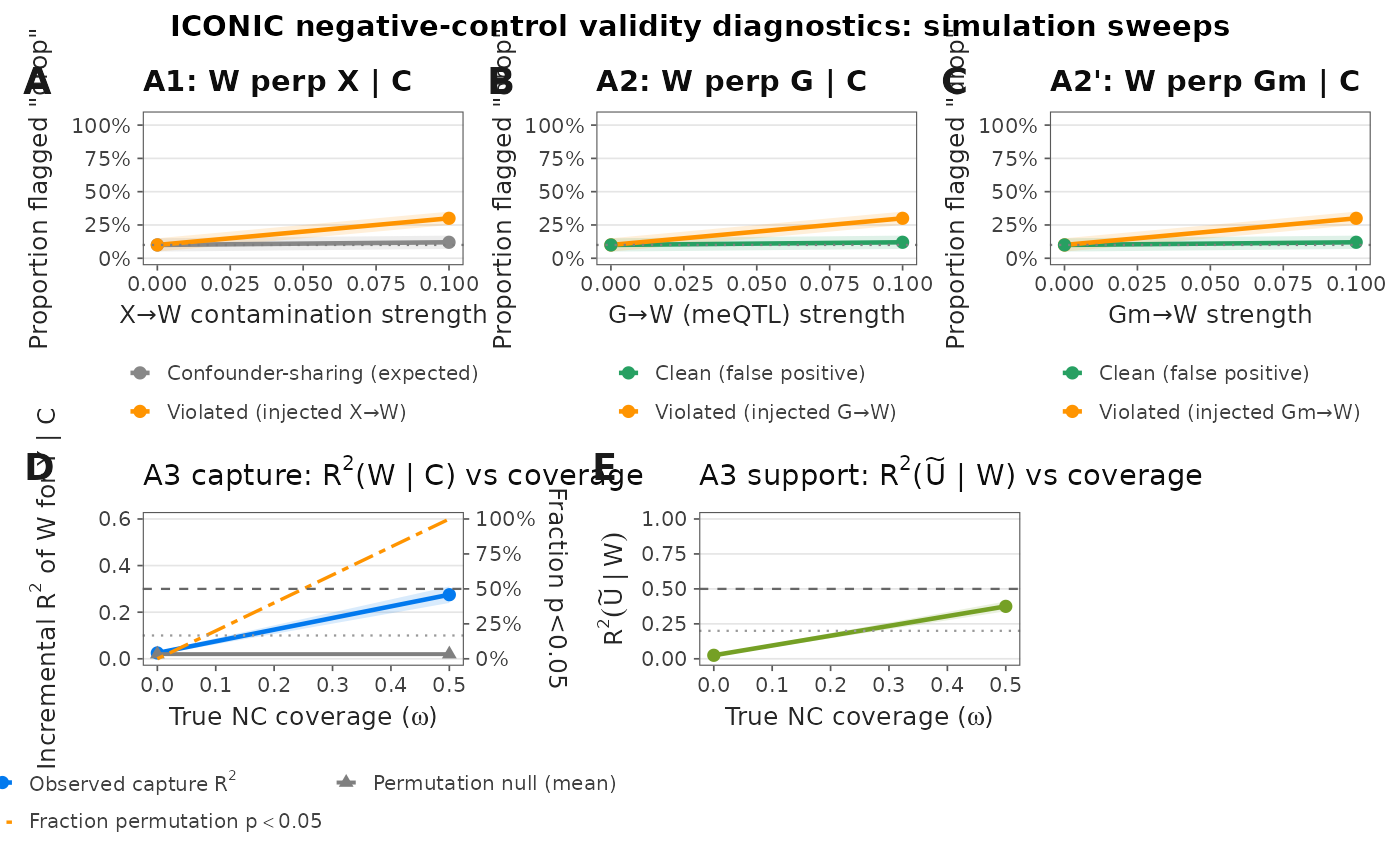
Produces a 5-panel figure sweeping the empirical NC validity diagnostics. Panels: (A) A1 W perp X | C, (B) A2 W perp G | C, (C) A2' W perp Gm | C, (D) A3 covariance-capture versus true coverage omega (with permutation-null mean and the fraction of replicates with permutation p < 0.05 on a secondary axis), and (E) A3 support R2(Utilde | W) versus omega.
Arguments
- panels
List returned by
sweep_nc_validity().- file
Optional file path to save the figure (cairo_pdf, so the omega and Utilde glyphs render).
- width
Figure width in inches. Default 10.
- height
Figure height in inches. Default 6.5.
Examples
# Toy panels standing in for sweep_nc_validity() output
panels <- list(
  panel_a = data.frame(contamination = c(0, 0.1),
    violated_mean = c(0.1, 0.3), violated_sd = 0.05,
    confounding_mean = c(0.1, 0.12), confounding_sd = 0.05),
  panel_b = data.frame(meqtl = c(0, 0.1),
    violated_mean = c(0.1, 0.3), violated_sd = 0.05,
    clean_mean = c(0.1, 0.12), clean_sd = 0.05),
  panel_d = data.frame(eqtl = c(0, 0.1),
    violated_mean = c(0.1, 0.3), violated_sd = 0.05,
    clean_mean = c(0.1, 0.12), clean_sd = 0.05),
  panel_capture_support = data.frame(
    omega = rep(c(0, 0.5), each = 2), rep = 1:2,
    capture_R2 = c(0.02, 0.03, 0.25, 0.30),
    capture_p = c(0.40, 0.60, 0.01, 0.02),
    null_R2 = 0.02,
    support_R2 = c(0.02, 0.03, 0.35, 0.40),
    frac_adds_coverage = 1))
plot_nc_validity_diagnostics(panels)