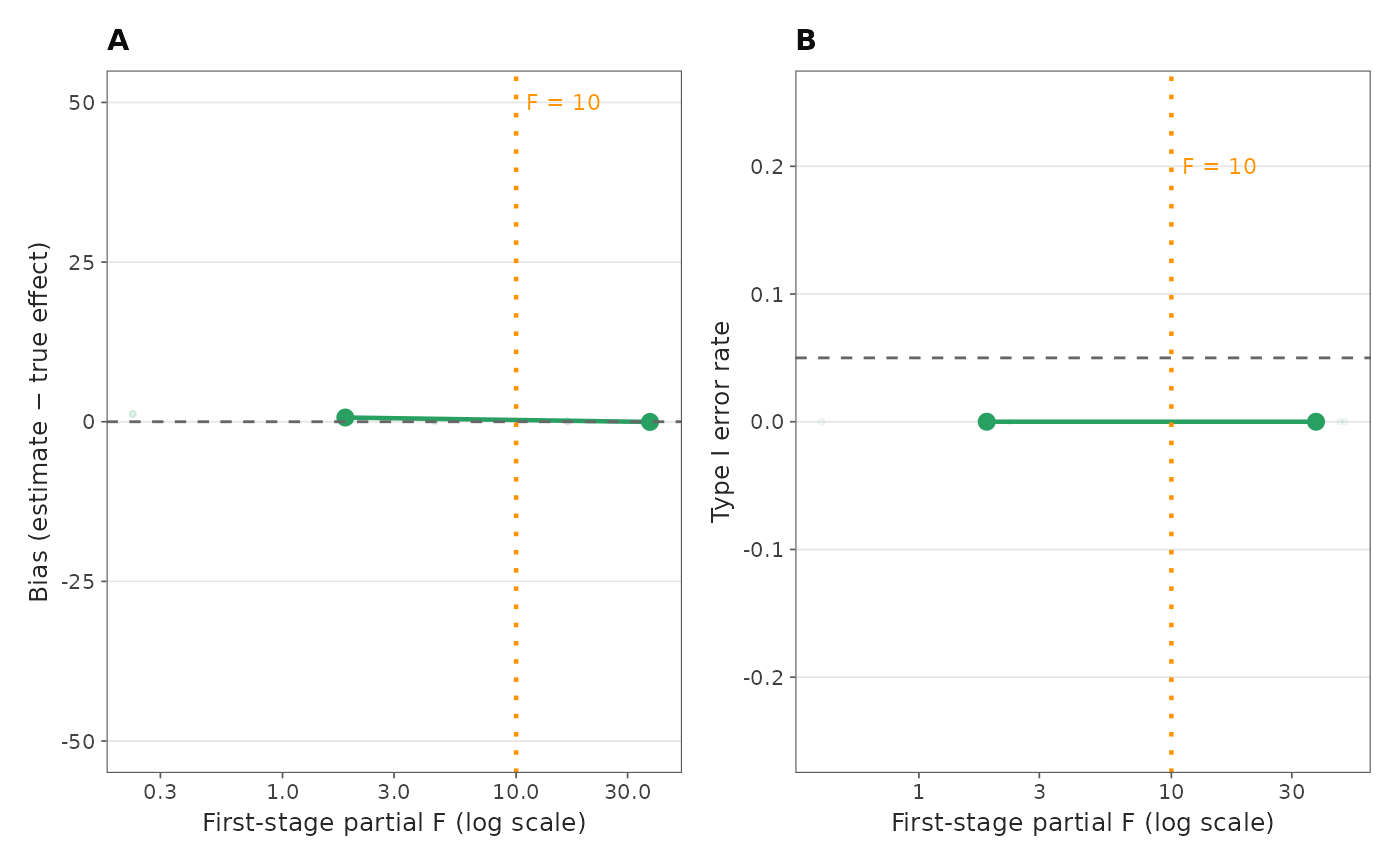
Produces a 2-panel figure showing IV2SLS bias and Type I error as a function of first-stage partial F-statistic, with the conventional weak-instrument threshold (F = 10) marked.
Arguments
- results
Data frame from
sweep_instrument_strength().- tau
True total effect used in the sweep.
- file
Optional file path to save the figure.
- width
Figure width in inches.
- height
Figure height in inches.
Examples
res <- sweep_instrument_strength(pi_GX_grid = c(0.05, 0.2), n_iter = 2)
#> Running instrument-strength sweep...
#>  pi_GX=0.05: 4 tasks (sequential)
#>   pi_GX=0.05: 25% (1/4) [0s]
#>   pi_GX=0.05: 50% (2/4) [0s]
#>   pi_GX=0.05: 75% (3/4) [0s]
#>   pi_GX=0.05: 100% (4/4) [0s]
#>  pi_GX = 0.05 done (mean F = 1.9)
#>  pi_GX=0.2: 4 tasks (sequential)
#>   pi_GX=0.2: 25% (1/4) [0s]
#>   pi_GX=0.2: 50% (2/4) [0s]
#>   pi_GX=0.2: 75% (3/4) [0s]
#>   pi_GX=0.2: 100% (4/4) [0s]
#>  pi_GX = 0.20 done (mean F = 37.4)
plot_instrument_strength_sweep(res)