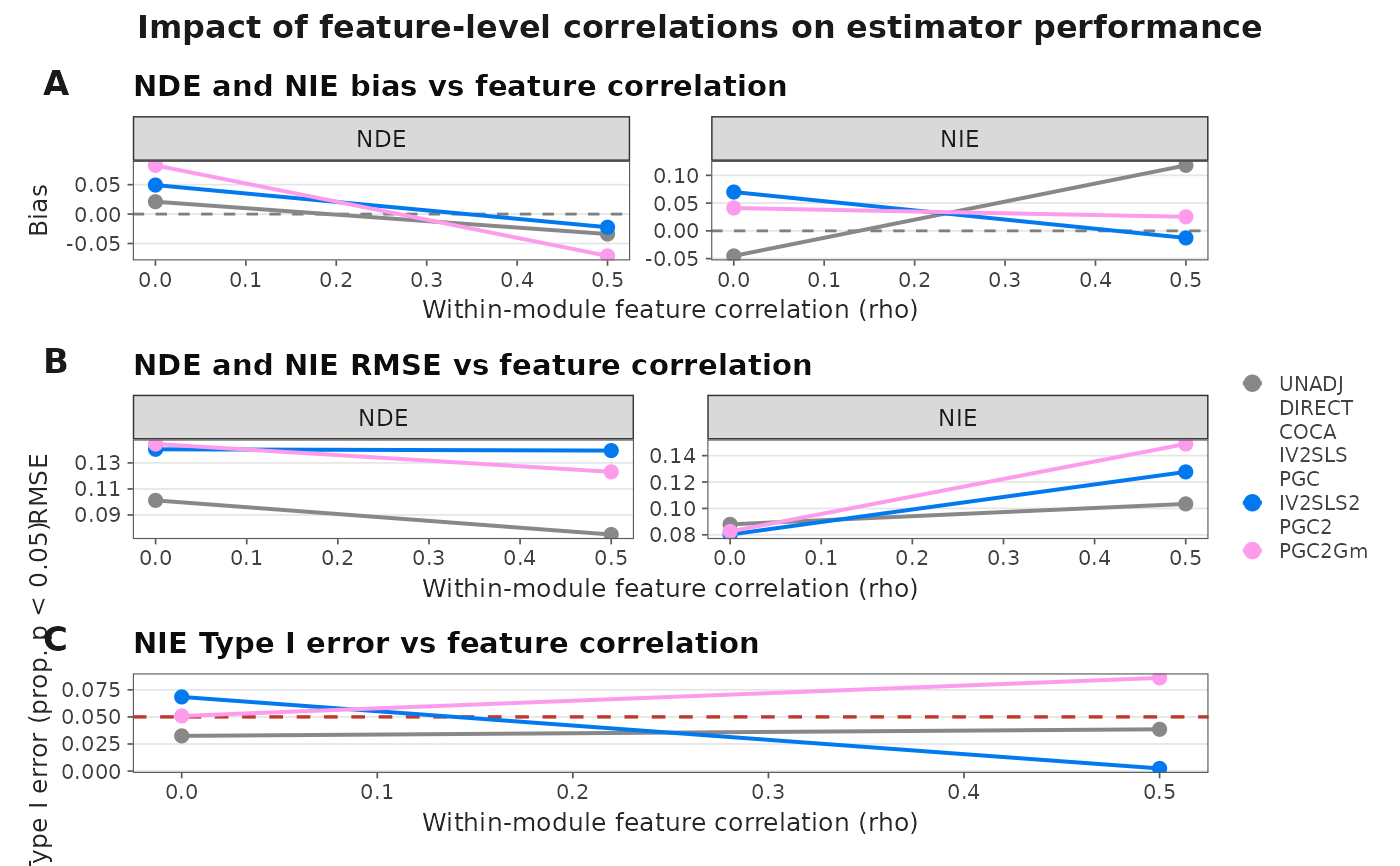
Produces a 3-panel figure showing how estimator performance changes as within-module feature correlation increases, modelling co-expression modules in a correlated omics panel.
Usage
plot_feature_correlation_sweep(
  sweep_results,
  null_results = NULL,
  file = NULL,
  width = 10,
  height = 12
)
Arguments
- sweep_results
Results from
sweep_mediation_param("feat_cor", ...): a list with$summary(data frame with columnsparam_value,method,NDE_bias,NIE_bias,NDE_rmse,NIE_rmse).- null_results
Optional results from
sweep_mediation_null_by_conf(..., feat_cor = ...)run withfeat_corswept: a data frame with columnsfeat_cor,method,NIE_type1. IfNULL, Panel C is omitted and the figure has 2 panels.- file
Optional file path to save the figure.
- width
Figure width in inches. Default 10.
- height
Figure height in inches. Default 12.
Details
Panel A: NDE and NIE bias vs feature correlation strength, faceted by estimand. Panel B: NDE and NIE RMSE vs feature correlation strength, faceted by estimand. Panel C: NIE Type I error vs feature correlation strength.
Examples
# Toy inputs standing in for sweep_mediation_param("feat_cor", ...) output
sweep <- list(summary = expand.grid(param_value = c(0, 0.5),
  method = c("UNADJ", "IV2SLS2", "PGC2Gm")))
sweep$summary$NDE_bias <- rnorm(nrow(sweep$summary), 0, 0.05)
sweep$summary$NIE_bias <- rnorm(nrow(sweep$summary), 0, 0.05)
sweep$summary$NDE_rmse <- runif(nrow(sweep$summary), 0.05, 0.15)
sweep$summary$NIE_rmse <- runif(nrow(sweep$summary), 0.05, 0.15)
null <- expand.grid(feat_cor = c(0, 0.5),
  method = c("UNADJ", "IV2SLS2", "PGC2Gm"))
null$NIE_type1 <- runif(nrow(null), 0, 0.1)
plot_feature_correlation_sweep(sweep, null)