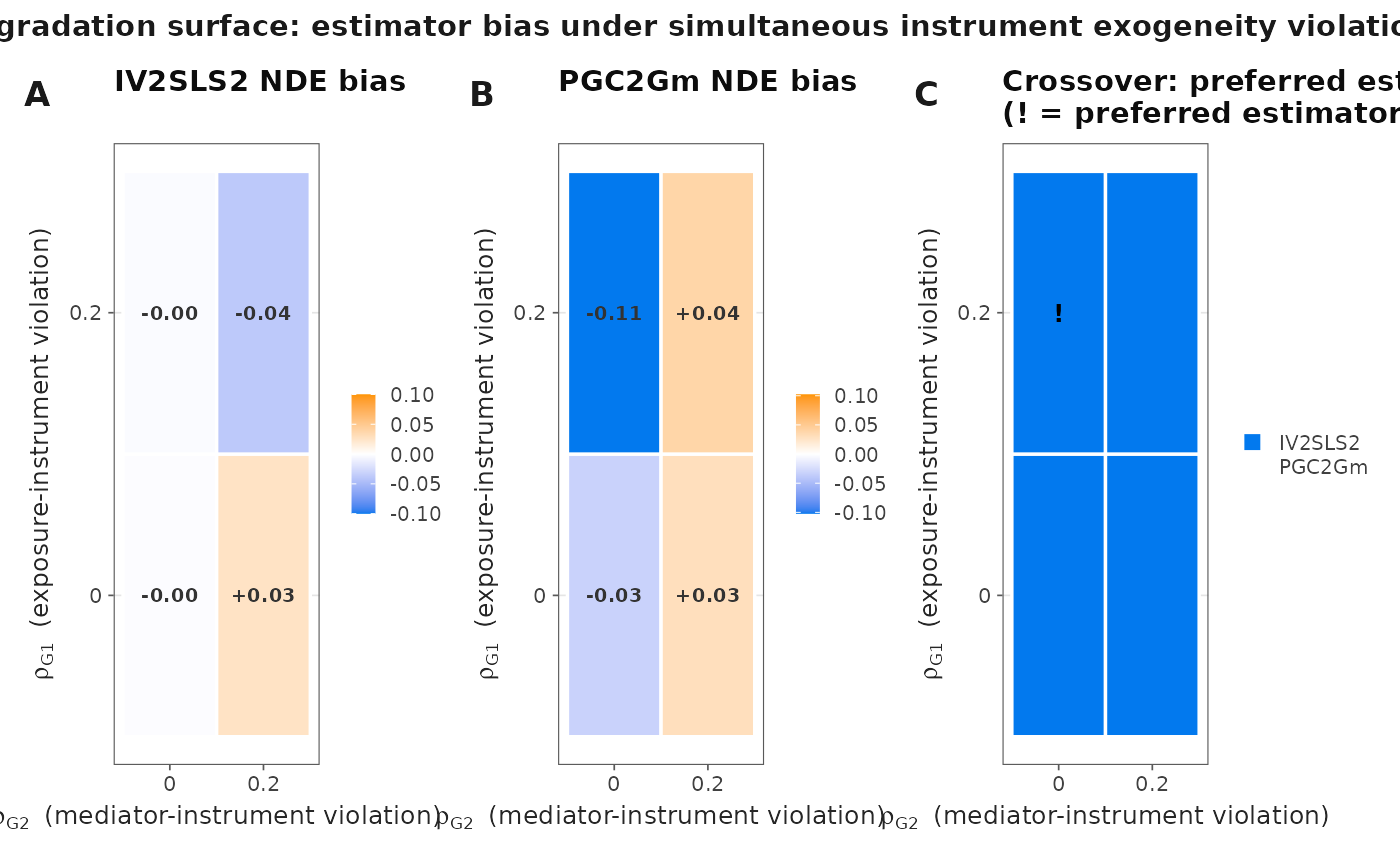
Produces a 3-panel figure showing estimator bias under simultaneous instrument exogeneity violations. Panels: (A) IV2SLS2 NDE bias surface, (B) PGC2Gm NDE bias surface, (C) crossover map showing which estimator has lower |NDE bias| at each grid cell.
Arguments
- results
Data frame with columns
rho_G1,rho_G2,method,NDE_bias,NIE_bias, and derivedNDE_abs,NIE_abs. Typically built by sweepingsweep_mediation_param()across a rho_G1 x rho_G2 grid.- rho_G1_grid
Numeric vector of exposure-instrument violation values.
- rho_G2_grid
Numeric vector of mediator-instrument violation values.
- omega_facet
Logical: when the sensitivity surface swept
omega_1/omega_2(more than one distinct value), facet the rho_G1 x rho_G2 heatmaps by the omega cell. DefaultTRUE. Ignored when omega was not swept.- file
Optional file path to save the figure.
- width
Figure width in inches.
- height
Figure height in inches.