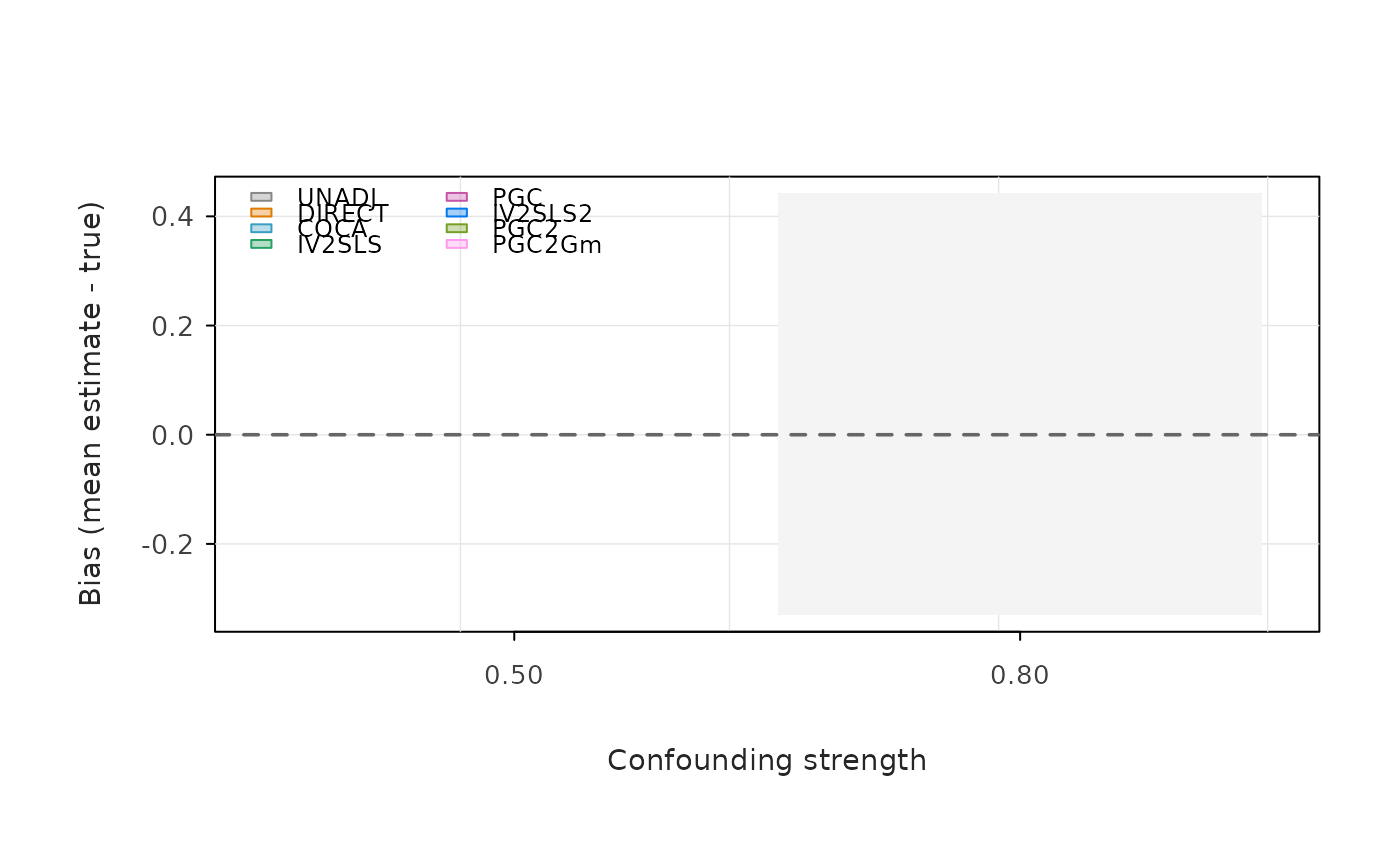
Grouped boxplots of per-seed bias across a parameter sweep
Usage
plot_bias_boxplot(
  iter_bias,
  param_grid,
  xlab,
  ylab = "Bias (mean estimate - true)",
  main = "",
  xfmt = "%.2f",
  legend_pos = "topleft",
  methods = iconic_method_order
)
Arguments
- iter_bias
Data frame with columns iter, method, bias, pval.
- param_grid
Sorted numeric vector of parameter values.
- xlab
X-axis label.
- ylab
Y-axis label. Default "Bias (mean estimate - true)".
- main
Plot title.
- xfmt
Format string for x-axis labels. Default "%.2f".
- legend_pos
Legend position. Default "topleft".
- methods
Methods to include. Default: all five.
Value
Invisibly returns NULL; called for the side effect of drawing a boxplot of bias across parameter values.
Examples
sweep <- sweep_param("conf_str", c(0.5, 0.8), n_iter = 2,
  n_samples = 100, n_features = 5)
plot_bias_boxplot(sweep$iter_bias, c(0.5, 0.8),
  xlab = "Confounding strength")